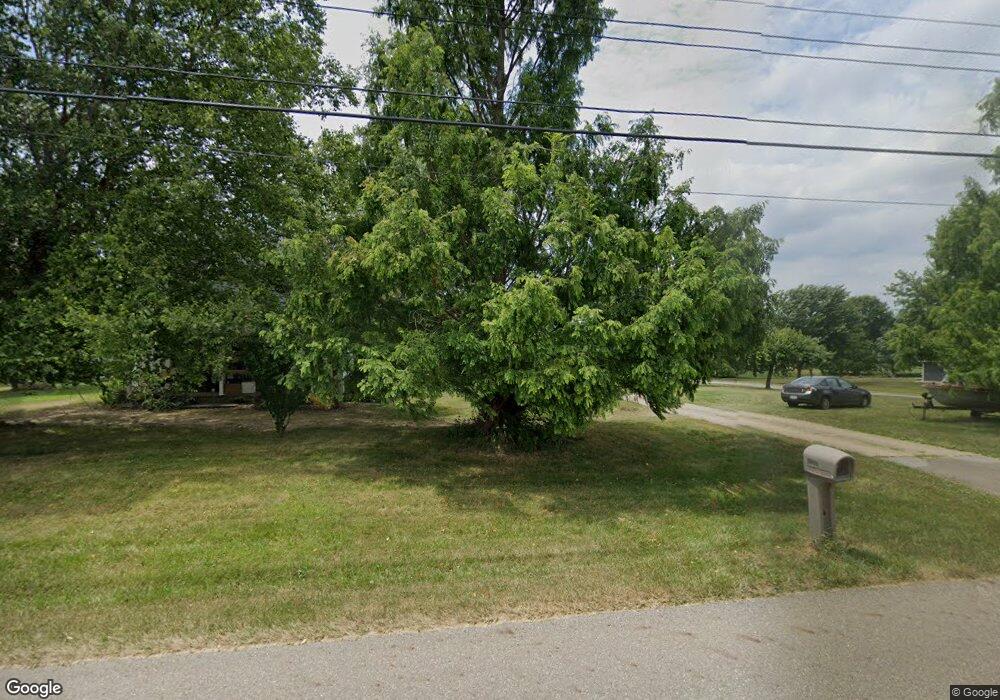
4707 Maplegrove Ave Louisville, OH 44641
Estimated Value: $242,076 - $298,000
4
Beds
2
Baths
1,683
Sq Ft
$163/Sq Ft
Est. Value
About This Home
This home is located at 4707 Maplegrove Ave, Louisville, OH 44641 and is currently estimated at $274,269, approximately $162 per square foot. 4707 Maplegrove Ave is a home located in Stark County with nearby schools including Louisville High School.
Ownership History
Date
Name
Owned For
Owner Type
Purchase Details
Closed on
Sep 18, 2008
Sold by
Valentine Bradley S and Valentine Brenda L
Bought by
Davis Joshua J and Davis Siobhan N
Current Estimated Value
Home Financials for this Owner
Home Financials are based on the most recent Mortgage that was taken out on this home.
Original Mortgage
$137,255
Outstanding Balance
$91,425
Interest Rate
6.55%
Mortgage Type
FHA
Estimated Equity
$182,844
Purchase Details
Closed on
Dec 30, 1999
Sold by
Harter Loren P
Bought by
Valentine Bradley S and Valentine Brenda L
Home Financials for this Owner
Home Financials are based on the most recent Mortgage that was taken out on this home.
Original Mortgage
$66,300
Interest Rate
7.37%
Purchase Details
Closed on
Mar 26, 1997
Sold by
Harter Dorothy A
Bought by
Harter Loren P and Harter Dana S
Home Financials for this Owner
Home Financials are based on the most recent Mortgage that was taken out on this home.
Original Mortgage
$84,000
Interest Rate
7.73%
Mortgage Type
New Conventional
Create a Home Valuation Report for This Property
The Home Valuation Report is an in-depth analysis detailing your home's value as well as a comparison with similar homes in the area
Home Values in the Area
Average Home Value in this Area
Purchase History
| Date | Buyer | Sale Price | Title Company |
|---|---|---|---|
| Davis Joshua J | $138,000 | Attorney | |
| Valentine Bradley S | $78,000 | -- | |
| Harter Loren P | $106,000 | -- |
Source: Public Records
Mortgage History
| Date | Status | Borrower | Loan Amount |
|---|---|---|---|
| Open | Davis Joshua J | $137,255 | |
| Closed | Valentine Bradley S | $66,300 | |
| Previous Owner | Harter Loren P | $84,000 |
Source: Public Records
Tax History Compared to Growth
Tax History
| Year | Tax Paid | Tax Assessment Tax Assessment Total Assessment is a certain percentage of the fair market value that is determined by local assessors to be the total taxable value of land and additions on the property. | Land | Improvement |
|---|---|---|---|---|
| 2025 | -- | $62,900 | $15,540 | $47,360 |
| 2024 | -- | $62,900 | $15,540 | $47,360 |
| 2023 | $2,096 | $43,020 | $13,690 | $29,330 |
| 2022 | $2,102 | $43,020 | $13,690 | $29,330 |
| 2021 | $2,108 | $43,020 | $13,690 | $29,330 |
| 2020 | $1,772 | $38,190 | $12,360 | $25,830 |
| 2019 | $1,779 | $36,970 | $12,360 | $24,610 |
| 2018 | $1,718 | $36,970 | $12,360 | $24,610 |
| 2017 | $1,677 | $34,450 | $11,550 | $22,900 |
| 2016 | $1,376 | $28,890 | $11,100 | $17,790 |
| 2015 | $1,380 | $28,890 | $11,100 | $17,790 |
| 2014 | $1,300 | $25,170 | $9,660 | $15,510 |
| 2013 | $653 | $25,170 | $9,660 | $15,510 |
Source: Public Records
Map
Nearby Homes
- 4384 Swallen Ave
- 5765 Maplegrove Ave
- 5990 Meese Rd NE
- 5495 Meese Rd NE
- 832 Meese Rd NE
- 10025 Georgetown St
- 510 Sycamore Dr
- 1812 E Broad St
- 8896 Rue Helena St
- 780 Thewes Ave
- 1616 Airpark Dr
- 6052 N Nickelplate St
- 1445 Washington Blvd
- 3390 Meese Rd NE
- 1413 Washington Blvd
- 0 Michigan Blvd
- 1415 Presidents St
- 1104 E Broad St
- 807 Washington Ave
- 1016 Parkview Dr
- 4673 Maplegrove Ave
- 4675 Maplegrove Ave
- 4771 Maplegrove Ave
- 4762 Maplegrove Ave
- 4801 Maplegrove Ave
- 4621 Maplegrove Ave
- 4805 Maplegrove Ave
- 4680 Maplegrove Ave
- 4833 Maplegrove Ave
- 4739 Maplegrove Ave
- 4544 Maplegrove Ave
- 4895 Maplegrove Ave
- 4591 Lakeknoll St
- 4482 Maplegrove Ave
- 4907 Maplegrove Ave
- 4588 Lakeknoll St
- 4520 Foster Dr
- 4456 Maplegrove Ave
- 4516 Foster Dr
- 4524 Foster Dr