4707 Puritan Cir Unit 723 Tampa, FL 33617
East Lake-Orient Park NeighborhoodEstimated Value: $207,000 - $219,000
3
Beds
2
Baths
1,757
Sq Ft
$122/Sq Ft
Est. Value
About This Home
This home is located at 4707 Puritan Cir Unit 723, Tampa, FL 33617 and is currently estimated at $213,570, approximately $121 per square foot. 4707 Puritan Cir Unit 723 is a home located in Hillsborough County with nearby schools including Robles Elementary School, Greco Middle School, and King High School.
Ownership History
Date
Name
Owned For
Owner Type
Purchase Details
Closed on
Dec 8, 2022
Sold by
Waterside Property Management And Rental
Bought by
Newton Michael W
Current Estimated Value
Purchase Details
Closed on
May 31, 2022
Sold by
River Oaks Condominium I Association Inc
Bought by
Newton Michael
Purchase Details
Closed on
May 9, 2022
Sold by
River Oaks Condominium I Association Inc
Bought by
Newton Michael
Purchase Details
Closed on
Jan 25, 2012
Sold by
Bell Dena K
Bought by
River Oaks Condominium I Association Inc
Purchase Details
Closed on
May 1, 2006
Sold by
Mazur Joseph L
Bought by
Bell Dena K
Home Financials for this Owner
Home Financials are based on the most recent Mortgage that was taken out on this home.
Original Mortgage
$113,600
Interest Rate
10.02%
Mortgage Type
Fannie Mae Freddie Mac
Create a Home Valuation Report for This Property
The Home Valuation Report is an in-depth analysis detailing your home's value as well as a comparison with similar homes in the area
Home Values in the Area
Average Home Value in this Area
Purchase History
| Date | Buyer | Sale Price | Title Company |
|---|---|---|---|
| Newton Michael W | -- | -- | |
| Newton Michael | -- | Glausier Knight Jones Pllc | |
| Newton Michael | -- | Glausier Knight Jones Pllc | |
| River Oaks Condominium I Association Inc | -- | None Available | |
| Bell Dena K | $148,000 | Alday Donalson Title Agencie |
Source: Public Records
Mortgage History
| Date | Status | Borrower | Loan Amount |
|---|---|---|---|
| Previous Owner | Bell Dena K | $113,600 |
Source: Public Records
Tax History Compared to Growth
Tax History
| Year | Tax Paid | Tax Assessment Tax Assessment Total Assessment is a certain percentage of the fair market value that is determined by local assessors to be the total taxable value of land and additions on the property. | Land | Improvement |
|---|---|---|---|---|
| 2024 | $2,486 | $183,980 | $100 | $183,880 |
| 2023 | $3,097 | $176,457 | $100 | $176,357 |
| 2022 | $1,640 | $142,384 | $100 | $142,284 |
| 2021 | $1,378 | $101,618 | $100 | $101,518 |
| 2020 | $1,284 | $84,106 | $100 | $84,006 |
| 2019 | $1,142 | $68,872 | $100 | $68,772 |
| 2018 | $1,102 | $69,423 | $0 | $0 |
| 2017 | $930 | $49,620 | $0 | $0 |
| 2016 | $837 | $39,062 | $0 | $0 |
| 2015 | $778 | $35,511 | $0 | $0 |
| 2014 | $697 | $32,283 | $0 | $0 |
| 2013 | -- | $33,985 | $0 | $0 |
Source: Public Records
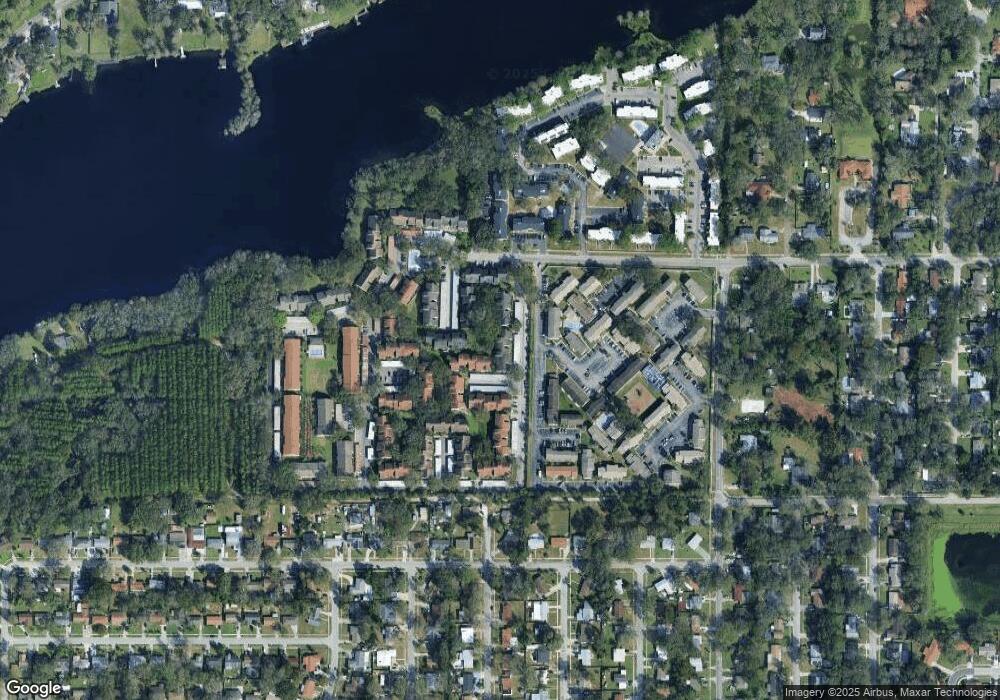
Map
Nearby Homes
- 4709 Puritan Cir Unit 702
- 5119 Puritan Cir Unit 1125
- 5125 Puritan Cir Unit 1103
- 5151 Puritan Cir Unit 1022
- 4725 Puritan Cir Unit 603
- 5103 Puritan Cir
- 5138 Puritan Cir Unit 1322
- 7877 Niagara Ave Unit 1802
- 4769 Puritan Cir Unit 401
- 7809 Niagara Ave Unit 2105
- 7811 Niagara Ave Unit 2125
- 4909 Puritan Cir Unit 2202
- 7832 Niagara Ave Unit 323
- 7818 Niagara Ave Unit 205
- 4607 Riverhills Dr
- 4428 Tuna Dr
- 4616 River Hills Dr
- 4429 Dolphin Dr
- 4419 Dolphin Dr
- 8004 N 46th St
- 4709 Puritan Cir Unit 4709
- 4703 Puritan Cir Unit 724
- 4705 Puritan Cir Unit 703
- 4709 Puritan Cir
- 4715 Puritan Cir Unit 721
- 4713 Puritan Cir Unit 701
- 5159 Puritan Cir Unit 925
- 5169 Puritan Cir
- 5161 Puritan Cir
- 5165 Puritan Cir Unit 903
- 5159 Puritan Cir
- 5173 Puritan Cir Unit 901
- 5175 Puritan Cir
- 5163 Puritan Cir Unit 924
- 5171 Puritan Cir Unit 922
- 5157 Puritan Cir Unit 905
- 5167 Puritan Cir
- 5169 Puritan Cir Unit 5169
- 5159 Puritan Cir Unit 5159
- 4607 Puritan Rd Unit 824