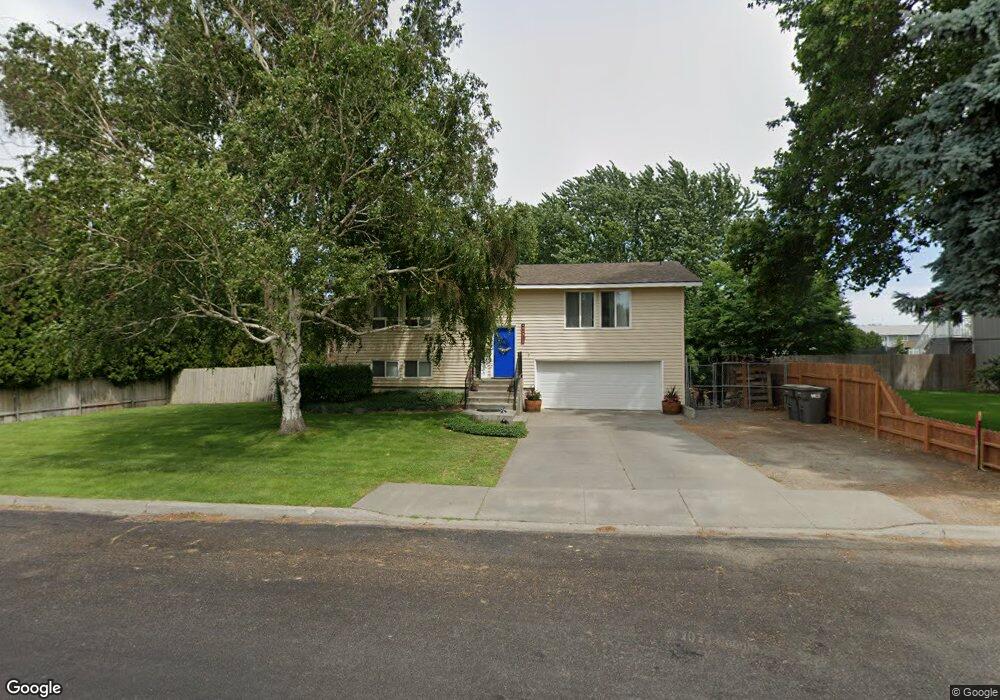
4707 S Kent St Unit Large Lot Kennewick, WA 99337
Estimated Value: $417,319 - $470,000
3
Beds
2
Baths
1,944
Sq Ft
$227/Sq Ft
Est. Value
About This Home
This home is located at 4707 S Kent St Unit Large Lot, Kennewick, WA 99337 and is currently estimated at $441,080, approximately $226 per square foot. 4707 S Kent St Unit Large Lot is a home located in Benton County with nearby schools including Cascade Elementary School, Horse Heaven Hills Middle School, and Kennewick High School.
Ownership History
Date
Name
Owned For
Owner Type
Purchase Details
Closed on
Apr 6, 2021
Sold by
Radigan Christopher R and Radigan Aubrey L
Bought by
Funciello Francisco Vincinzo
Current Estimated Value
Home Financials for this Owner
Home Financials are based on the most recent Mortgage that was taken out on this home.
Original Mortgage
$312,337
Outstanding Balance
$281,547
Interest Rate
2.9%
Mortgage Type
FHA
Estimated Equity
$159,533
Purchase Details
Closed on
May 30, 2018
Sold by
Osborne Robert M and Osborne Corinne L
Bought by
Radigan Christopher R and Radigan Aubrey L
Home Financials for this Owner
Home Financials are based on the most recent Mortgage that was taken out on this home.
Original Mortgage
$218,500
Interest Rate
4.4%
Mortgage Type
New Conventional
Create a Home Valuation Report for This Property
The Home Valuation Report is an in-depth analysis detailing your home's value as well as a comparison with similar homes in the area
Home Values in the Area
Average Home Value in this Area
Purchase History
| Date | Buyer | Sale Price | Title Company |
|---|---|---|---|
| Funciello Francisco Vincinzo | $318,100 | Chicago Title Company | |
| Radigan Christopher R | $230,000 | Frontier Title & Escrow Co |
Source: Public Records
Mortgage History
| Date | Status | Borrower | Loan Amount |
|---|---|---|---|
| Open | Funciello Francisco Vincinzo | $312,337 | |
| Previous Owner | Radigan Christopher R | $218,500 |
Source: Public Records
Tax History Compared to Growth
Tax History
| Year | Tax Paid | Tax Assessment Tax Assessment Total Assessment is a certain percentage of the fair market value that is determined by local assessors to be the total taxable value of land and additions on the property. | Land | Improvement |
|---|---|---|---|---|
| 2024 | $2,864 | $366,970 | $70,000 | $296,970 |
| 2023 | $2,864 | $357,390 | $70,000 | $287,390 |
| 2022 | $2,173 | $280,750 | $70,000 | $210,750 |
| 2021 | $2,135 | $221,090 | $50,000 | $171,090 |
| 2020 | $2,175 | $210,720 | $50,000 | $160,720 |
| 2019 | $1,810 | $205,540 | $50,000 | $155,540 |
| 2018 | $2,088 | $174,430 | $50,000 | $124,430 |
| 2017 | $1,781 | $164,060 | $50,000 | $114,060 |
| 2016 | $2,249 | $152,890 | $27,500 | $125,390 |
| 2015 | $2,253 | $152,890 | $27,500 | $125,390 |
| 2014 | -- | $152,890 | $27,500 | $125,390 |
| 2013 | -- | $152,890 | $27,500 | $125,390 |
Source: Public Records
Map
Nearby Homes
- 4805 S Jean St
- 900 W 44th Place
- 4202 S Kent St
- 1503 W 46th Ave
- 5373 S Kent St
- 4505 S Dayton Ct
- 4004 S Jean St
- 4105 S Olympia St
- 1614 W 51st Ave
- 5590 S Lyle Place
- 4209 S Cascade St
- 1591 W 52nd Ave
- 207 W 48th Ave
- 5211 S Palouse Ct -Lot 225
- NKA S Olympia Street (12 38 Acres)
- 5214 S Palouse Ct- Lot 224
- 4001 S Quincy St
- 108 W 45th Ave
- TBD S Sharron Ct
- 1911 W 51st Ave
- 4707 S Kent St
- 4803 S Kent St
- 905 W 47th Ave
- 4704 S Jean St
- 4805 S Kent St
- 903 W 47th Ave
- 4802 S Jean St
- 4704 S Kent St
- 4802 S Kent St
- 4804 S Jean St Unit Great Price and a Po
- 4804 S Jean St Unit Big home, big lot, b
- 4804 S Jean St
- 906 W 47th Ave
- 4702 S Kent St
- 906 W 49th Ave
- 4804 S Kent St
- 904 W 47th Ave
- 4606 S Kent St
- 4605 S Kent St
- 4806 S Kent St