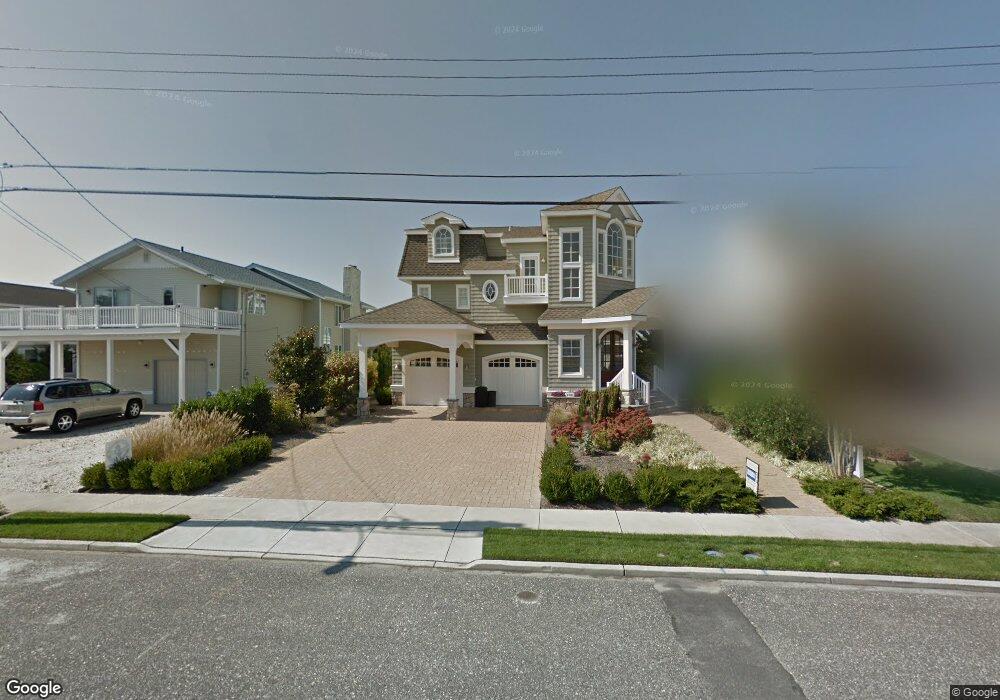
4708 4th Ave Avalon, NJ 08202
Estimated Value: $6,506,000 - $7,739,426
Studio
--
Bath
5,429
Sq Ft
$1,289/Sq Ft
Est. Value
About This Home
This home is located at 4708 4th Ave, Avalon, NJ 08202 and is currently estimated at $6,997,809, approximately $1,288 per square foot. 4708 4th Ave is a home located in Cape May County with nearby schools including Avalon Elementary School.
Ownership History
Date
Name
Owned For
Owner Type
Purchase Details
Closed on
Nov 24, 2014
Sold by
Sandbar Development Llc
Bought by
Dobbeck Scott E
Current Estimated Value
Home Financials for this Owner
Home Financials are based on the most recent Mortgage that was taken out on this home.
Original Mortgage
$2,625,000
Outstanding Balance
$855,192
Interest Rate
3.1%
Mortgage Type
New Conventional
Estimated Equity
$6,142,617
Purchase Details
Closed on
Dec 15, 2006
Sold by
Ferrero A Thomas and Ferrero Eileen T
Bought by
Sandbar Development Llc
Purchase Details
Closed on
May 15, 1991
Sold by
New Jersey Dep
Bought by
Ferrero Ferrero A and Ferrero Eileen T
Purchase Details
Closed on
Aug 22, 1990
Sold by
Ferrero A Thomas Co-Exec
Bought by
Ferrero Ferrero Jr A and Ferrero Eileen T
Create a Home Valuation Report for This Property
The Home Valuation Report is an in-depth analysis detailing your home's value as well as a comparison with similar homes in the area
Home Values in the Area
Average Home Value in this Area
Purchase History
We collect this data history from publicly available records. To have your information removed, we recommend requesting removal directly through your county’s website.
| Date | Buyer | Sale Price | Title Company |
|---|---|---|---|
| Dobbeck Scott E | $3,500,000 | Seaboard Title Agency | |
| Sandbar Development Llc | $2,600,000 | None Available | |
| Ferrero Ferrero A | $3,700 | -- | |
| Ferrero Ferrero Jr A | -- | -- |
Source: Public Records
Mortgage History
We collect this data history from publicly available records. To have your information removed, we recommend requesting removal directly through your county’s website.
| Date | Status | Borrower | Loan Amount |
|---|---|---|---|
| Open | Dobbeck Scott E | $2,625,000 |
Source: Public Records
Tax History
| Year | Tax Paid | Tax Assessment Tax Assessment Total Assessment is a certain percentage of the fair market value that is determined by local assessors to be the total taxable value of land and additions on the property. | Land | Improvement |
|---|---|---|---|---|
| 2025 | $22,549 | $3,672,400 | $1,700,000 | $1,972,400 |
| 2024 | $22,549 | $3,672,400 | $1,700,000 | $1,972,400 |
| 2023 | $22,365 | $3,672,400 | $1,700,000 | $1,972,400 |
| 2022 | $20,859 | $3,672,400 | $1,700,000 | $1,972,400 |
| 2021 | $20,088 | $3,672,400 | $1,700,000 | $1,972,400 |
| 2020 | $19,317 | $3,672,400 | $1,700,000 | $1,972,400 |
| 2019 | $18,729 | $3,672,400 | $1,700,000 | $1,972,400 |
| 2018 | $17,921 | $3,672,400 | $1,700,000 | $1,972,400 |
| 2017 | $18,807 | $3,382,500 | $1,600,000 | $1,782,500 |
| 2016 | $18,604 | $3,382,500 | $1,600,000 | $1,782,500 |
| 2015 | $18,299 | $3,382,500 | $1,600,000 | $1,782,500 |
| 2014 | $18,096 | $3,382,500 | $1,600,000 | $1,782,500 |
Source: Public Records
Map
Nearby Homes
- 4640 Ocean Dr
- 298 50th St
- 19 Sea Gull Dr
- 4202 5th Ave
- 264 41st St
- 4040 Dune Dr
- 383 39th St Unit West
- 198 40th St
- 5765 Ocean Dr
- 132 38th St
- 253 35th St Unit WEST
- 6088 Ocean Dr
- 173 33rd St Unit 3
- 3142 Ocean Dr Unit South
- 3140 Ocean Dr
- 3140 Ocean Dr Unit North
- 6229 Dune Dr
- 179 32nd St
- 3030 Ocean Dr Unit N
- 3027 Dune Dr Unit 3
Your Personal Tour Guide
Ask me questions while you tour the home.