Estimated Value: $504,000 - $585,000
4
Beds
3
Baths
2,557
Sq Ft
$214/Sq Ft
Est. Value
About This Home
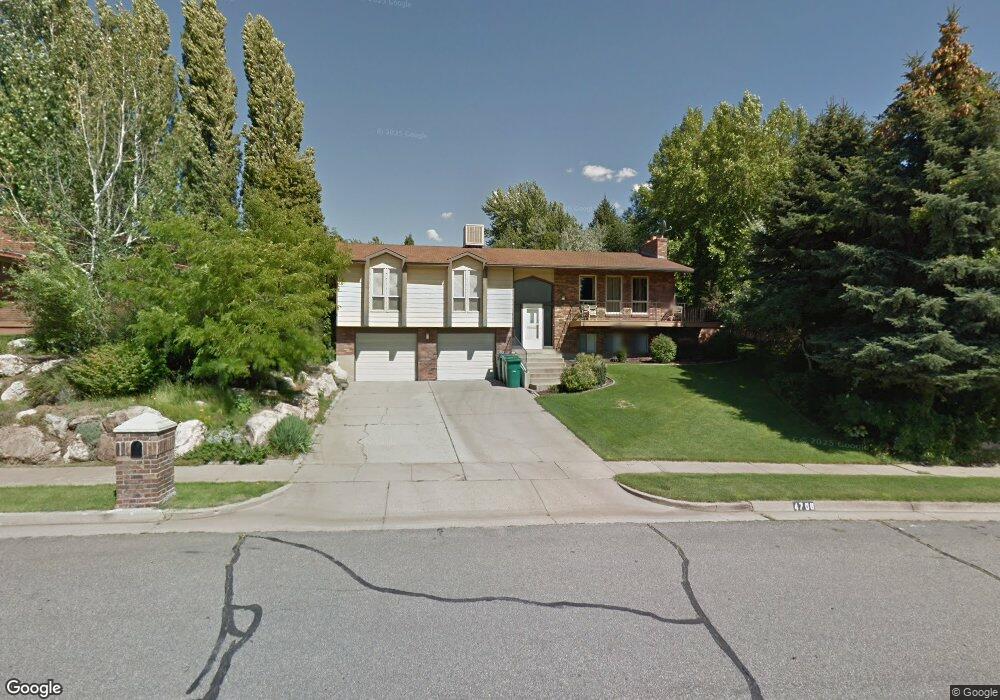
This home is located at 4708 Jefferson Ave, Ogden, UT 84403 and is currently estimated at $547,494, approximately $214 per square foot. 4708 Jefferson Ave is a home located in Weber County with nearby schools including Burch Creek School, South Ogden Junior High School, and Bonneville High School.
Ownership History
Date
Name
Owned For
Owner Type
Purchase Details
Closed on
Sep 12, 2006
Sold by
Harris Seth and Garrett Mary
Bought by
Harris Seth and Gladwell Michela
Current Estimated Value
Purchase Details
Closed on
Jan 9, 2006
Sold by
Harris Seth
Bought by
Harris Seth and Garrett Mary
Home Financials for this Owner
Home Financials are based on the most recent Mortgage that was taken out on this home.
Original Mortgage
$41,240
Interest Rate
5.48%
Mortgage Type
Stand Alone Second
Purchase Details
Closed on
Nov 21, 2005
Sold by
Garry Jonathan A and Garry Lori N
Bought by
Harris Seth
Home Financials for this Owner
Home Financials are based on the most recent Mortgage that was taken out on this home.
Original Mortgage
$41,240
Interest Rate
5.48%
Mortgage Type
Stand Alone Second
Purchase Details
Closed on
Aug 8, 1997
Sold by
Bowker Mott Belinda K
Bought by
Garry Jonathan A and Garry Lori N
Home Financials for this Owner
Home Financials are based on the most recent Mortgage that was taken out on this home.
Original Mortgage
$153,900
Interest Rate
7.61%
Create a Home Valuation Report for This Property
The Home Valuation Report is an in-depth analysis detailing your home's value as well as a comparison with similar homes in the area
Home Values in the Area
Average Home Value in this Area
Purchase History
| Date | Buyer | Sale Price | Title Company |
|---|---|---|---|
| Harris Seth | -- | None Available | |
| Harris Seth | -- | None Available | |
| Harris Seth | -- | Executive Title | |
| Garry Jonathan A | -- | Associated Title |
Source: Public Records
Mortgage History
| Date | Status | Borrower | Loan Amount |
|---|---|---|---|
| Closed | Harris Seth | $41,240 | |
| Open | Harris Seth | $164,960 | |
| Previous Owner | Garry Jonathan A | $153,900 |
Source: Public Records
Tax History Compared to Growth
Tax History
| Year | Tax Paid | Tax Assessment Tax Assessment Total Assessment is a certain percentage of the fair market value that is determined by local assessors to be the total taxable value of land and additions on the property. | Land | Improvement |
|---|---|---|---|---|
| 2025 | $3,710 | $292,367 | $87,822 | $204,545 |
| 2024 | $3,576 | $285,449 | $87,821 | $197,628 |
| 2023 | $3,436 | $275,000 | $86,054 | $188,946 |
| 2022 | $3,348 | $276,100 | $83,302 | $192,798 |
| 2021 | $2,863 | $395,000 | $77,488 | $317,512 |
| 2020 | $2,631 | $337,000 | $59,333 | $277,667 |
| 2019 | $2,497 | $304,000 | $54,274 | $249,726 |
| 2018 | $2,465 | $286,000 | $54,274 | $231,726 |
| 2017 | $2,128 | $243,000 | $54,274 | $188,726 |
| 2016 | $1,924 | $116,351 | $28,878 | $87,473 |
| 2015 | $1,843 | $122,206 | $28,878 | $93,328 |
| 2014 | $1,763 | $101,969 | $28,878 | $73,091 |
Source: Public Records
Map
Nearby Homes
- 4675 Jefferson Ave
- 4790 Burch Creek Dr
- 4825 Burch Creek Dr
- 796 Nancy Dr
- 4521 Madison Ave
- 4586 Porter Ave
- 4540 Gramercy Ave
- 4477 Porter Ave
- 4893 S 1075 E
- 4803 S 350 E
- 3112 S Adams Ave
- 4823 Brinker Ave
- 4245 S 675 E
- 889 Ben Lomond Ave
- 715 S 350 E Unit 2
- 1045 E 5100 S
- 4226 Gramercy Ave
- 4215 Gramercy Ave
- 4948 S 1150 E
- 325 E 4425 S
- 4702 Jefferson Ave
- 4720 Jefferson Ave
- 688 E 4750 S
- 680 E 4750 S
- 4740 Jefferson Ave
- 4696 Jefferson Ave
- 4693 Madison Ave
- 4715 Madison Ave
- 4709 Jefferson Ave
- 4725 Jefferson Ave Unit 14
- 4725 Jefferson Ave
- 4699 Porter Ave
- 672 E 4750 S
- 4723 Madison Ave
- 4739 Jefferson Ave
- 4686 Jefferson Ave
- 4661 Madison Ave
- 685 E 4750 S
- 712 Edgewood Dr
- 4697 Porter Ave