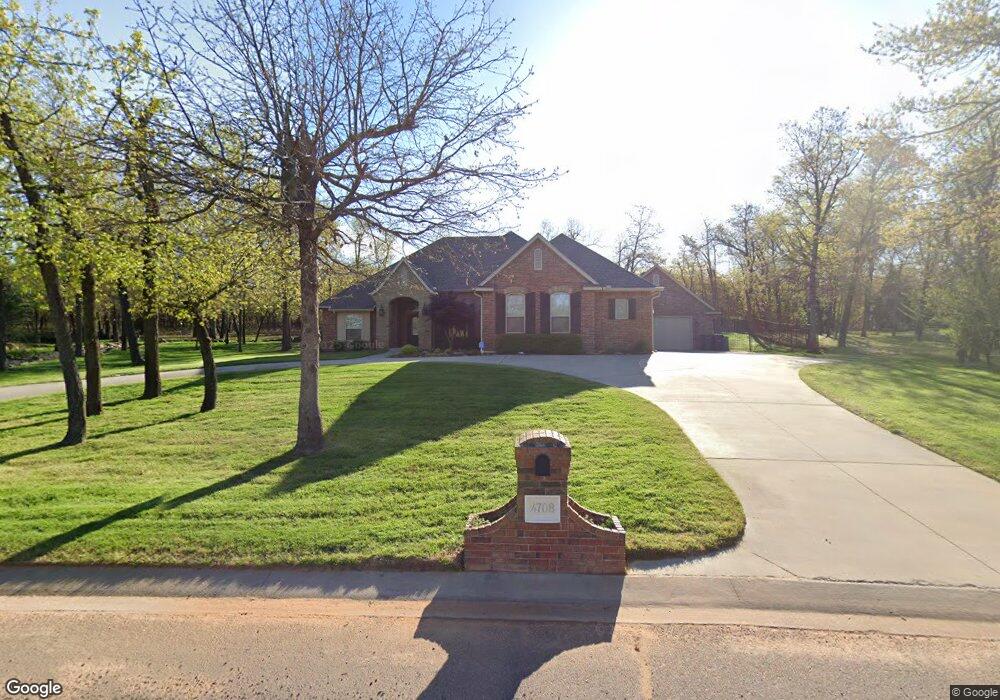
4708 Old Lantern Way Choctaw, OK 73020
Estimated Value: $462,000 - $560,000
4
Beds
3
Baths
2,480
Sq Ft
$199/Sq Ft
Est. Value
About This Home
This home is located at 4708 Old Lantern Way, Choctaw, OK 73020 and is currently estimated at $494,369, approximately $199 per square foot. 4708 Old Lantern Way is a home located in Oklahoma County with nearby schools including Indian Meridian Elementary School, James Griffith Intermediate Elementary School, and Choctaw Middle School.
Ownership History
Date
Name
Owned For
Owner Type
Purchase Details
Closed on
Jun 2, 2023
Sold by
Rohrbach Miriam
Bought by
Rohrbach Miriam and Rohrbach Kathleen M
Current Estimated Value
Purchase Details
Closed on
Jan 12, 2016
Sold by
Schoonover Robert C and Schoonover Theresa J
Bought by
Rohrbach Robert M and Rohrbach Miriam
Purchase Details
Closed on
Apr 2, 2009
Sold by
Avalon Homes & Properties Llc
Bought by
Schoonover Robert C and Schoonover Theresa J
Home Financials for this Owner
Home Financials are based on the most recent Mortgage that was taken out on this home.
Original Mortgage
$275,793
Interest Rate
5.24%
Mortgage Type
FHA
Purchase Details
Closed on
Aug 29, 2008
Sold by
Briar Development Llc
Bought by
Schoonover Robert C and Schoonover Theresa J
Home Financials for this Owner
Home Financials are based on the most recent Mortgage that was taken out on this home.
Original Mortgage
$238,400
Interest Rate
6.54%
Mortgage Type
Construction
Create a Home Valuation Report for This Property
The Home Valuation Report is an in-depth analysis detailing your home's value as well as a comparison with similar homes in the area
Home Values in the Area
Average Home Value in this Area
Purchase History
| Date | Buyer | Sale Price | Title Company |
|---|---|---|---|
| Rohrbach Miriam | -- | None Listed On Document | |
| Rohrbach Robert M | $324,000 | Capitol Abstract Title | |
| Schoonover Robert C | -- | Capitol Abstract & Title Co | |
| Schoonover Robert C | $42,000 | Capitol Abstract & Title Co |
Source: Public Records
Mortgage History
| Date | Status | Borrower | Loan Amount |
|---|---|---|---|
| Previous Owner | Schoonover Robert C | $275,793 | |
| Previous Owner | Schoonover Robert C | $238,400 |
Source: Public Records
Tax History Compared to Growth
Tax History
| Year | Tax Paid | Tax Assessment Tax Assessment Total Assessment is a certain percentage of the fair market value that is determined by local assessors to be the total taxable value of land and additions on the property. | Land | Improvement |
|---|---|---|---|---|
| 2024 | $4,886 | $38,218 | $7,636 | $30,582 |
| 2023 | $4,762 | $37,105 | $5,925 | $31,180 |
| 2022 | $4,575 | $36,025 | $8,826 | $27,199 |
| 2021 | $4,546 | $36,025 | $8,627 | $27,398 |
| 2020 | $4,580 | $36,025 | $8,495 | $27,530 |
| 2019 | $4,591 | $36,025 | $8,345 | $27,680 |
| 2018 | $4,601 | $36,025 | $0 | $0 |
| 2017 | $4,580 | $36,024 | $8,345 | $27,679 |
| 2016 | $4,607 | $36,212 | $7,445 | $28,767 |
| 2015 | $4,495 | $35,157 | $7,483 | $27,674 |
| 2014 | $4,351 | $34,133 | $7,330 | $26,803 |
Source: Public Records
Map
Nearby Homes
- 0 SE 44th St
- 14691 SE 44th St
- 6621 S Choctaw Rd
- 15000 SE 50th St
- 15008 SE 50th St
- 5617 Asheville Way
- 4425 Huntington Pkwy
- 15301 SE 41st St
- 15101 SE 58th St
- 14025 SE 39th Cir
- 4900 Cinder Cir
- 4912 Cinder Cir
- 4905 Cinder Cir
- 4909 Cinder Cir
- 15024 SE 59th Terrace
- 0 SE 59th St
- 3309 Oakbriar Dr
- 21232 SE 32nd St
- 21236 SE 32nd St
- 21240 SE 32nd St
- 4700 Old Lantern Way
- 4800 Old Lantern Way
- 4701 Old Lantern Way
- 14724 SE 44th St
- 4600 Old Lantern Way
- 4801 Old Lantern Way
- 4601 Old Lantern Way
- 4820 Old Lantern Way
- 4821 Old Lantern Way
- 4520 Old Lantern Way
- 4520 Old Lantern Way
- 14818 SE 44th St
- 4521 Old Lantern Way
- 4900 Old Lantern Way
- 4901 Old Lantern Way
- 4920 Old Lantern Way
- 4909 Old Lantern Way
- 4801 Old School House Rd
- 4917 Old Lantern Way
- 14700 SE 44th St