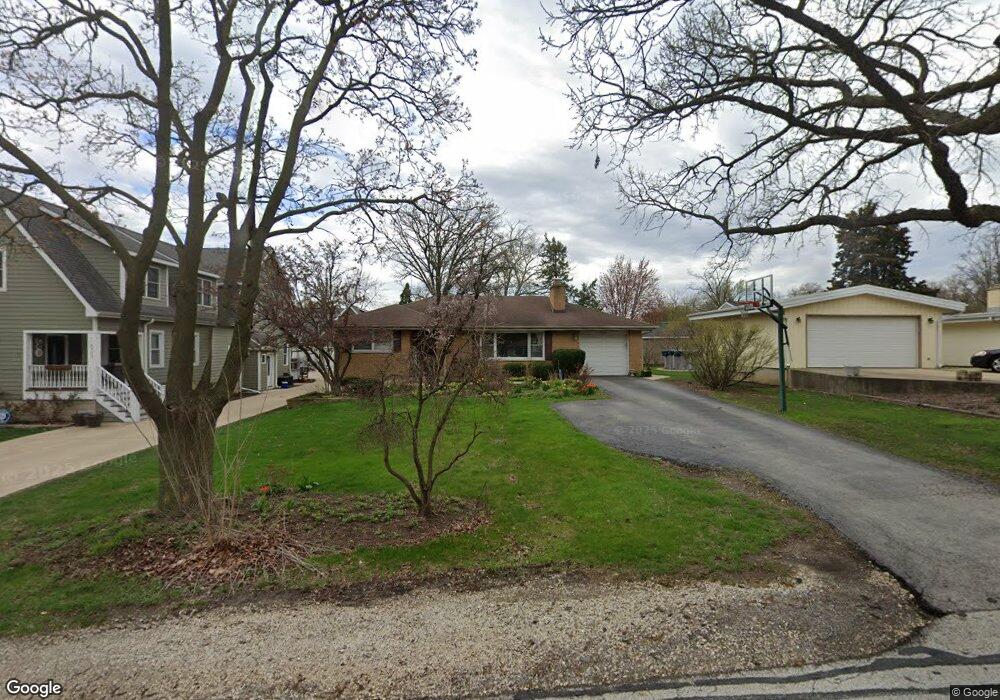
4708 Pershing Ave Downers Grove, IL 60515
Estimated Value: $378,000 - $533,000
--
Bed
1
Bath
1,759
Sq Ft
$266/Sq Ft
Est. Value
About This Home
This home is located at 4708 Pershing Ave, Downers Grove, IL 60515 and is currently estimated at $467,074, approximately $265 per square foot. 4708 Pershing Ave is a home located in DuPage County with nearby schools including Henry Puffer School, Herrick Middle School, and Downer Grove North High School.
Ownership History
Date
Name
Owned For
Owner Type
Purchase Details
Closed on
Nov 30, 2023
Sold by
Schellbach Brett and Schellbach Susanne M
Bought by
Schellbach Susanne M
Current Estimated Value
Home Financials for this Owner
Home Financials are based on the most recent Mortgage that was taken out on this home.
Original Mortgage
$252,921
Outstanding Balance
$248,826
Interest Rate
7.63%
Mortgage Type
New Conventional
Estimated Equity
$218,248
Purchase Details
Closed on
Mar 25, 1998
Sold by
Donnelly Robert W and Donnelly Sandra J
Bought by
Schellbach Brett T and Schellbach Susanne M
Home Financials for this Owner
Home Financials are based on the most recent Mortgage that was taken out on this home.
Original Mortgage
$124,800
Interest Rate
7.15%
Mortgage Type
Balloon
Create a Home Valuation Report for This Property
The Home Valuation Report is an in-depth analysis detailing your home's value as well as a comparison with similar homes in the area
Home Values in the Area
Average Home Value in this Area
Purchase History
| Date | Buyer | Sale Price | Title Company |
|---|---|---|---|
| Schellbach Susanne M | -- | None Listed On Document | |
| Schellbach Brett T | $156,000 | -- |
Source: Public Records
Mortgage History
| Date | Status | Borrower | Loan Amount |
|---|---|---|---|
| Open | Schellbach Susanne M | $252,921 | |
| Previous Owner | Schellbach Brett T | $124,800 |
Source: Public Records
Tax History Compared to Growth
Tax History
| Year | Tax Paid | Tax Assessment Tax Assessment Total Assessment is a certain percentage of the fair market value that is determined by local assessors to be the total taxable value of land and additions on the property. | Land | Improvement |
|---|---|---|---|---|
| 2024 | $7,980 | $147,526 | $60,516 | $87,010 |
| 2023 | $7,543 | $134,640 | $55,230 | $79,410 |
| 2022 | $7,571 | $134,640 | $55,230 | $79,410 |
| 2021 | $6,900 | $129,550 | $53,140 | $76,410 |
| 2020 | $6,787 | $127,220 | $52,180 | $75,040 |
| 2019 | $6,556 | $121,710 | $49,920 | $71,790 |
| 2018 | $6,299 | $115,590 | $47,410 | $68,180 |
| 2017 | $6,125 | $111,690 | $45,810 | $65,880 |
| 2016 | $6,062 | $107,650 | $44,150 | $63,500 |
| 2015 | $5,998 | $101,380 | $41,580 | $59,800 |
| 2014 | $5,944 | $97,730 | $40,080 | $57,650 |
| 2013 | $5,867 | $97,970 | $40,180 | $57,790 |
Source: Public Records
Map
Nearby Homes
- 4601 Wilson Ave
- 4512 Wilson Ave
- 4508 Stonewall Ave
- 4424 Arbor Cir Unit 3
- 2209 Arbor Cir Unit 5
- 4947 Stonewall Ave
- 4408 Stonewall Ave
- 4940 Cornell Ave
- 4522 Lee Ave
- 4848 Francisco Ave
- 1805 Gilbert Ave
- 4436 Lee Ave
- 4939 Lee Ave
- 4832 Seeley Ave
- 1436 Gilbert Lot 1 Ave
- 4022 Earlston Rd
- 1658 Janet St
- 4416 Seeley Ave
- 403 Provence Ct
- 4741 Montgomery Ave
- 4712 Pershing Ave
- 4700 Pershing Ave
- 2105 Chicago Ave
- 4716 Pershing Ave
- 4718 Pershing Ave
- 4709 Belmont Rd
- 4705 Belmont Rd
- 4717 Belmont Rd
- 4707 Belmont Rd
- 4707 Pershing Ave
- 4715 Pershing Ave
- 4709 Pershing Ave
- 4724 Pershing Ave
- 4701 Belmont Rd
- 4636 Pershing Ave
- 4717 Pershing Ave
- 4721 Belmont Rd
- 4637 Pershing Ave
- 4721 Pershing Ave
- 4728 Pershing Ave