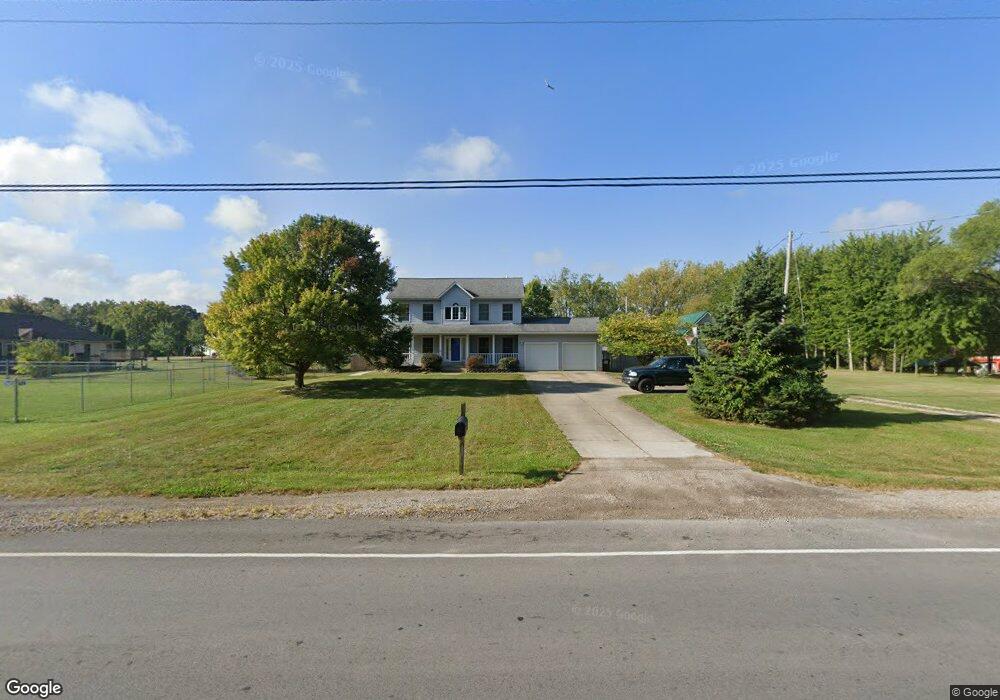
4708 Venice Rd Sandusky, OH 44870
Estimated Value: $129,000 - $140,000
3
Beds
2
Baths
1,425
Sq Ft
$94/Sq Ft
Est. Value
About This Home
This home is located at 4708 Venice Rd, Sandusky, OH 44870 and is currently estimated at $133,992, approximately $94 per square foot. 4708 Venice Rd is a home located in Erie County with nearby schools including Sandusky High School, Monroe Preparatory Academy, and Sandusky Central Catholic School.
Ownership History
Date
Name
Owned For
Owner Type
Purchase Details
Closed on
May 14, 2020
Sold by
Estep Harold E and Estep Patty L
Bought by
Kane Sue A
Current Estimated Value
Home Financials for this Owner
Home Financials are based on the most recent Mortgage that was taken out on this home.
Original Mortgage
$70,400
Outstanding Balance
$61,558
Interest Rate
3.3%
Mortgage Type
New Conventional
Estimated Equity
$72,434
Purchase Details
Closed on
Nov 29, 2018
Sold by
Wollf David E and Wollf Mary C
Bought by
Estep Harold E and Estep Patty L
Home Financials for this Owner
Home Financials are based on the most recent Mortgage that was taken out on this home.
Original Mortgage
$52,000
Interest Rate
4.8%
Mortgage Type
New Conventional
Purchase Details
Closed on
Jul 20, 2000
Sold by
Hackett Hilda L
Bought by
Wollf David E and Wollf Mary C
Home Financials for this Owner
Home Financials are based on the most recent Mortgage that was taken out on this home.
Original Mortgage
$28,000
Interest Rate
8.31%
Mortgage Type
New Conventional
Create a Home Valuation Report for This Property
The Home Valuation Report is an in-depth analysis detailing your home's value as well as a comparison with similar homes in the area
Home Values in the Area
Average Home Value in this Area
Purchase History
| Date | Buyer | Sale Price | Title Company |
|---|---|---|---|
| Kane Sue A | $88,000 | None Available | |
| Estep Harold E | $65,000 | None Available | |
| Wollf David E | $73,000 | -- |
Source: Public Records
Mortgage History
| Date | Status | Borrower | Loan Amount |
|---|---|---|---|
| Open | Kane Sue A | $70,400 | |
| Previous Owner | Estep Harold E | $52,000 | |
| Previous Owner | Wollf David E | $28,000 |
Source: Public Records
Tax History
| Year | Tax Paid | Tax Assessment Tax Assessment Total Assessment is a certain percentage of the fair market value that is determined by local assessors to be the total taxable value of land and additions on the property. | Land | Improvement |
|---|---|---|---|---|
| 2025 | $1,553 | $41,685 | $5,250 | $36,435 |
| 2024 | $1,553 | $41,685 | $5,250 | $36,435 |
| 2023 | $1,605 | $31,398 | $2,520 | $28,878 |
| 2022 | $1,558 | $31,395 | $2,520 | $28,875 |
| 2021 | $1,572 | $31,400 | $2,520 | $28,880 |
| 2020 | $1,368 | $25,100 | $2,520 | $22,580 |
| 2019 | $1,407 | $25,100 | $2,520 | $22,580 |
| 2018 | $919 | $25,100 | $2,520 | $22,580 |
| 2017 | $934 | $25,320 | $2,520 | $22,800 |
| 2016 | $934 | $25,320 | $2,520 | $22,800 |
| 2015 | $885 | $25,320 | $2,520 | $22,800 |
| 2014 | $753 | $23,690 | $2,520 | $21,170 |
| 2013 | $745 | $23,690 | $2,520 | $21,170 |
Source: Public Records
Map
Nearby Homes
- 402 Snow Ct
- 4708 Venice Heights Blvd Unit 204
- 4601 Pinewood Dr Unit 194
- S/L 46 Walnut Ridge Ln
- S/L 3 Cold Creek Blvd
- S/L 85 S Meadow Dr
- 63 Old Mill Place
- 0 Venice Rd
- 1 Venice Rd
- 5804 Mccartney Rd
- 1019 Winnebago Ave
- 5917 Heywood Rd
- 427 Windcrest Ct
- 2614 Tiffin Ave Unit 103
- 0 Mccartney Rd
- 2305 Bardshar Rd
- 34 Anderson St
- 1 Perkins Ave
- 0 Lakeside Unit 20253835
- 1807 Mills St
- 4708 Venice Rd
- 4708 Venice Rd Unit 107
- 4708 Venice Rd
- 4708 Venice Rd
- 4708 Venice Rd Unit 103
- 4708 Venice Rd
- 4708 Venice Rd
- 4708 Venice Rd
- 4708 Venice Rd
- 4708 Venice Rd
- 4708 Venice Rd
- 4708 Venice Rd
- 4708 Venice Rd
- 4708 Venice Rd
- 4708 Venice Rd
- 4708 Venice Rd
- 4708 Venice Rd Unit 202
- 4704 Venice Rd
- 4704 Venice Rd
- 4704 Venice Rd
Your Personal Tour Guide
Ask me questions while you tour the home.