Estimated Value: $302,000 - $326,000
--
Bed
2
Baths
2,151
Sq Ft
$144/Sq Ft
Est. Value
About This Home
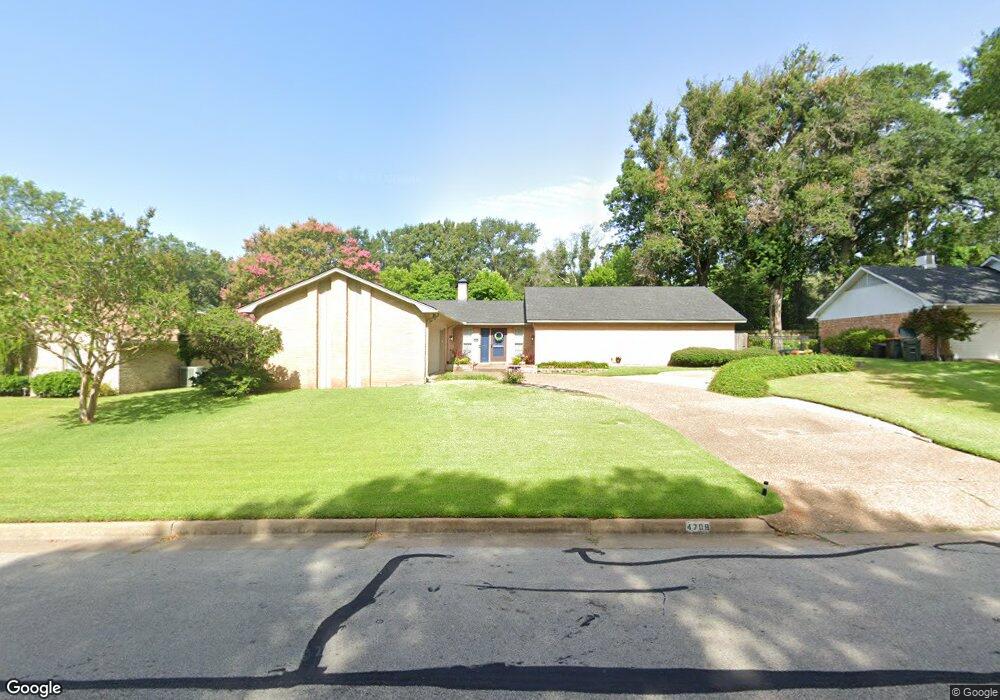
This home is located at 4709 Chad Dr, Tyler, TX 75703 and is currently estimated at $310,027, approximately $144 per square foot. 4709 Chad Dr is a home located in Smith County with nearby schools including Woods Elementary School, Hubbard Middle School, and Tyler Legacy High School.
Ownership History
Date
Name
Owned For
Owner Type
Purchase Details
Closed on
Jul 20, 2017
Sold by
Merryfield Lynne
Bought by
Leburn Jeffrey T and Leburn Jordan L
Current Estimated Value
Home Financials for this Owner
Home Financials are based on the most recent Mortgage that was taken out on this home.
Original Mortgage
$171,830
Outstanding Balance
$141,333
Interest Rate
3.62%
Mortgage Type
FHA
Estimated Equity
$168,694
Purchase Details
Closed on
Aug 28, 2006
Sold by
Trump Stephen N and Trump Janet M
Bought by
Merryfield Lynne
Home Financials for this Owner
Home Financials are based on the most recent Mortgage that was taken out on this home.
Original Mortgage
$105,000
Interest Rate
6.72%
Mortgage Type
Purchase Money Mortgage
Create a Home Valuation Report for This Property
The Home Valuation Report is an in-depth analysis detailing your home's value as well as a comparison with similar homes in the area
Home Values in the Area
Average Home Value in this Area
Purchase History
| Date | Buyer | Sale Price | Title Company |
|---|---|---|---|
| Leburn Jeffrey T | -- | None Available | |
| Merryfield Lynne | -- | None Available |
Source: Public Records
Mortgage History
| Date | Status | Borrower | Loan Amount |
|---|---|---|---|
| Open | Leburn Jeffrey T | $171,830 | |
| Previous Owner | Merryfield Lynne | $105,000 |
Source: Public Records
Tax History Compared to Growth
Tax History
| Year | Tax Paid | Tax Assessment Tax Assessment Total Assessment is a certain percentage of the fair market value that is determined by local assessors to be the total taxable value of land and additions on the property. | Land | Improvement |
|---|---|---|---|---|
| 2025 | $3,466 | $297,595 | $50,598 | $246,997 |
| 2024 | $3,466 | $261,525 | $38,720 | $266,577 |
| 2023 | $4,144 | $273,009 | $38,720 | $234,289 |
| 2022 | $4,234 | $223,611 | $38,720 | $184,891 |
| 2021 | $4,122 | $196,487 | $38,720 | $157,767 |
| 2020 | $4,190 | $200,170 | $38,720 | $161,450 |
| 2019 | $3,892 | $178,002 | $19,360 | $158,642 |
| 2018 | $3,575 | $164,386 | $19,360 | $145,026 |
| 2017 | $3,510 | $164,386 | $19,360 | $145,026 |
| 2016 | $3,221 | $150,874 | $19,360 | $131,514 |
| 2015 | $2,385 | $150,454 | $19,360 | $131,094 |
| 2014 | $2,385 | $143,870 | $19,360 | $124,510 |
Source: Public Records
Map
Nearby Homes
- 1507 Kensington Dr
- 1401 Kidd Dr
- 4601 Cambridge Dr
- 1707 Picadilly Place
- 4805 Wendover Place
- 5104 Kingspark Cir
- 1705 Devonshire Dr
- 1021 Kingspark Dr
- 817 Woodhall Ct
- 5112 Timber Creek Dr
- 842 Ashford Ct
- 1809 Chipco Dr
- 1608 Yosemite Dr
- 1818 Kensington Dr
- 1811 Picadilly Place
- 5117 Stagecoach Dr
- 5117 Stagecoach St
- 1107 Pinedale Place
- 5133 Avenham Ct
- 5219 Stagecoach St
- 4709 4709 Chad Dr
- 4701 Chad Dr
- 4715 Chad Dr
- 4708 Stratford Dr
- 4708 4708 Stratford Dr
- 4700 Stratford Dr
- 1300 Balmoral Dr
- 4625 4625 Chad Dr
- 4718 4718 Chad Dr
- 4625 Chad Dr
- 4718 Chad Dr
- 4628 4628 Chad Dr
- 4726 4726 Chad Dr
- 4628 Chad Dr
- 4626 Stratford Dr
- 4726 Chad Dr
- 1311 Balmoral Dr
- 1301 1301 Balmoral
- 1301 Balmoral Dr
- 1406 Devonshire Dr