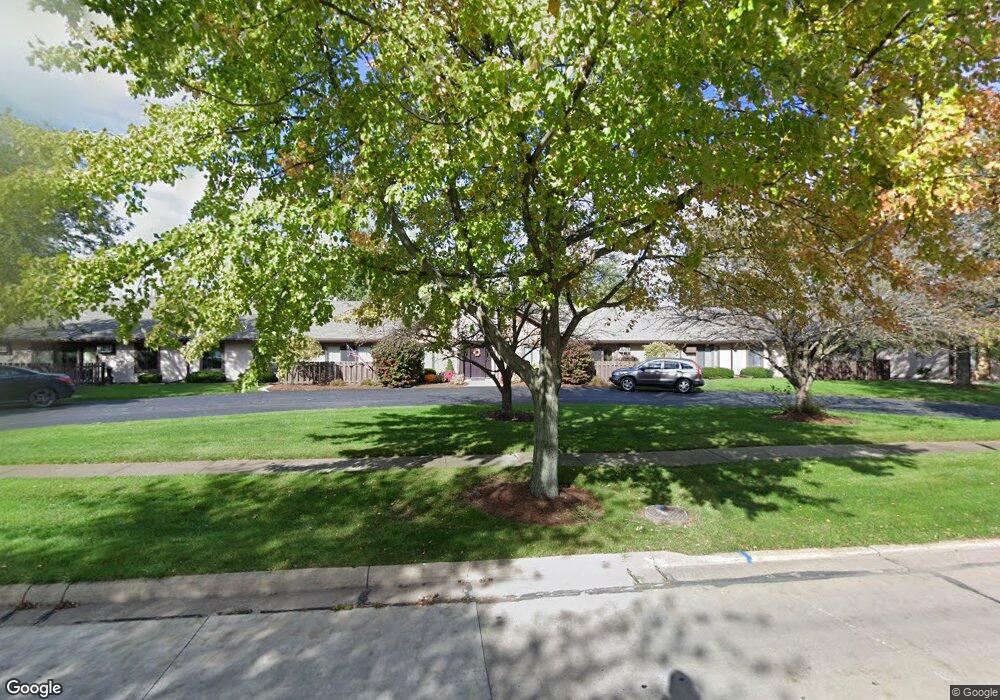
4709 Venice Heights Blvd Unit BLVD Sandusky, OH 44870
Estimated Value: $121,000 - $127,900
2
Beds
1
Bath
1,188
Sq Ft
$105/Sq Ft
Est. Value
About This Home
This home is located at 4709 Venice Heights Blvd Unit BLVD, Sandusky, OH 44870 and is currently estimated at $124,475, approximately $104 per square foot. 4709 Venice Heights Blvd Unit BLVD is a home located in Erie County with nearby schools including Sandusky High School, Sandusky Central Catholic School, and Firelands Christian Academy.
Ownership History
Date
Name
Owned For
Owner Type
Purchase Details
Closed on
Jul 30, 2025
Sold by
Fronizer Mitzi G
Bought by
Slyker Vivian
Current Estimated Value
Purchase Details
Closed on
Sep 26, 2016
Sold by
Fitzgerald Edward A
Bought by
Fronizer Mitzi G
Purchase Details
Closed on
Feb 26, 2015
Sold by
Federal Home Loan Mortgage Corporation
Bought by
Fitzgerald Edward A
Purchase Details
Closed on
Oct 6, 2014
Sold by
Windsor Robert
Bought by
Federal Home Loan Mortgage Corporation
Purchase Details
Closed on
Jun 7, 2010
Sold by
Souter Constance Marie and Souter Robert A
Bought by
Windsor Robert
Home Financials for this Owner
Home Financials are based on the most recent Mortgage that was taken out on this home.
Original Mortgage
$54,000
Interest Rate
5.14%
Mortgage Type
New Conventional
Create a Home Valuation Report for This Property
The Home Valuation Report is an in-depth analysis detailing your home's value as well as a comparison with similar homes in the area
Home Values in the Area
Average Home Value in this Area
Purchase History
| Date | Buyer | Sale Price | Title Company |
|---|---|---|---|
| Slyker Vivian | $120,000 | First American Title | |
| Fronizer Mitzi G | $67,000 | None Available | |
| Fitzgerald Edward A | -- | Intitle Agency Inc | |
| Federal Home Loan Mortgage Corporation | $37,000 | None Available | |
| Windsor Robert | $67,500 | Hartung Title |
Source: Public Records
Mortgage History
| Date | Status | Borrower | Loan Amount |
|---|---|---|---|
| Previous Owner | Windsor Robert | $54,000 |
Source: Public Records
Tax History Compared to Growth
Tax History
| Year | Tax Paid | Tax Assessment Tax Assessment Total Assessment is a certain percentage of the fair market value that is determined by local assessors to be the total taxable value of land and additions on the property. | Land | Improvement |
|---|---|---|---|---|
| 2024 | $1,568 | $38,927 | $5,250 | $33,677 |
| 2023 | $1,499 | $24,576 | $2,520 | $22,056 |
| 2022 | $1,220 | $24,584 | $2,520 | $22,064 |
| 2021 | $1,232 | $24,580 | $2,520 | $22,060 |
| 2020 | $1,252 | $22,960 | $2,520 | $20,440 |
| 2019 | $1,287 | $22,960 | $2,520 | $20,440 |
| 2018 | $1,289 | $22,960 | $2,520 | $20,440 |
| 2017 | $1,454 | $25,830 | $2,520 | $23,310 |
| 2016 | $963 | $25,830 | $2,520 | $23,310 |
| 2015 | $1,312 | $25,830 | $2,520 | $23,310 |
| 2014 | $1,249 | $24,140 | $2,520 | $21,620 |
| 2013 | $1,203 | $24,140 | $2,520 | $21,620 |
Source: Public Records
Map
Nearby Homes
- 4708 Venice Heights Blvd
- 4708 Venice Heights Blvd Unit 204
- 4708 Venice Heights Blvd Unit 101
- 4809 Venice Rd
- 802 S Meadow Dr
- 719 Cold Creek Blvd
- 0 Venice Rd
- 1 Venice Rd
- 5704 Mccartney Rd
- 3710 Venice Rd
- 4514 Homegardner Rd
- 0 Mccartney Rd
- 2614 Tiffin Ave
- 2614 Tiffin Ave Unit 103
- 0 Ohio 101
- 2234 Wilbert St
- 2002 Wilson St
- 0 Lakeside Unit 20253835
- 1 Perkins Ave
- 1319 Tiffin Ave
- 4709 Venice Heights Blvd Unit 125
- 4709 Venice Heights Blvd Unit 121
- 4709 Venice Heights Blvd
- 4709 Venice Heights Blvd Unit 120
- 4709 Venice Heights Blvd Unit 119
- 4709 Venice Heights Blvd Unit 118
- 4709 Venice Heights Blvd Unit 123
- 4709 Venice Heights Blvd Unit 117
- 4705 Venice Heights Blvd Unit 139
- 4705 Venice Heights Blvd Unit 129
- 4705 Venice Heights Blvd Unit 140
- 4705 Venice Heights Blvd
- 4705 Venice Heights Blvd Unit 135
- 4705 Venice Heights Blvd Unit 137
- 4705 Venice Heights Blvd Unit 127
- 4705 Venice Heights Blvd Unit 132
- 4705 Venice Heights Blvd Unit 136
- 518 Bardshar Rd Unit A
- 518 Bardshar Rd
- 518 Bardshar Rd Unit F