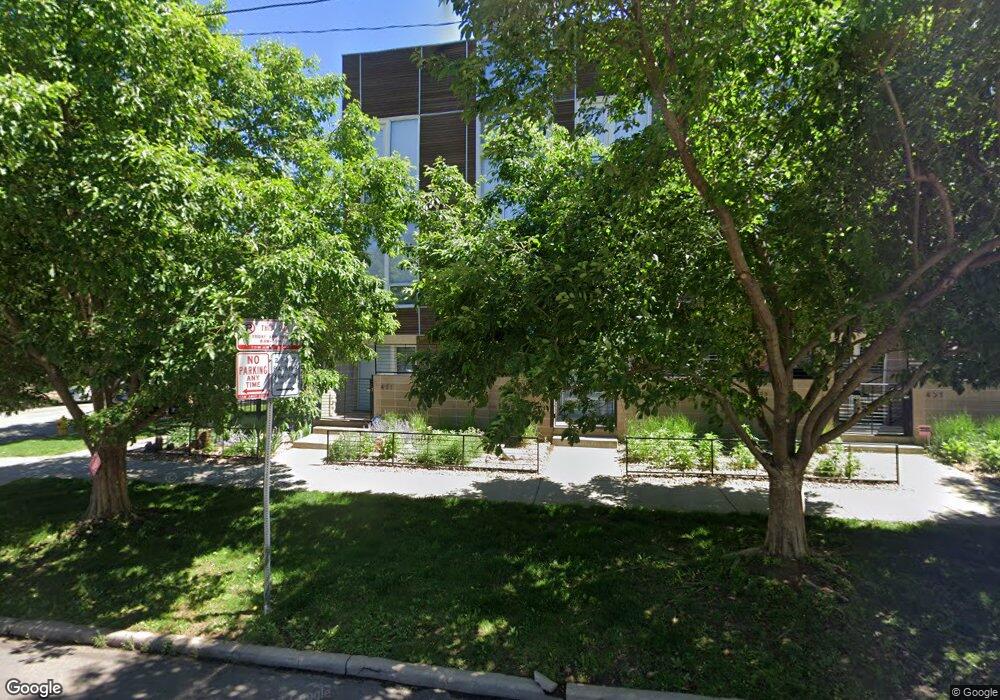
471 24th St Denver, CO 80205
Five Points NeighborhoodEstimated Value: $976,296 - $1,041,000
3
Beds
4
Baths
2,474
Sq Ft
$406/Sq Ft
Est. Value
About This Home
This home is located at 471 24th St, Denver, CO 80205 and is currently estimated at $1,004,824, approximately $406 per square foot. 471 24th St is a home located in Denver County with nearby schools including Whittier ECE-8 School, Cole Arts & Science Academy, and McAuliffe Manual Middle School.
Ownership History
Date
Name
Owned For
Owner Type
Purchase Details
Closed on
Oct 11, 2012
Sold by
Smith Demiah and Smith Phuong
Bought by
Smith Demian
Current Estimated Value
Purchase Details
Closed on
Oct 2, 2007
Sold by
Smith Demian and Smith Phuong
Bought by
Smith Demian and Smith Phuong
Purchase Details
Closed on
Jul 6, 2007
Sold by
Smith Demian
Bought by
Smith Demian and Smith Phuong
Home Financials for this Owner
Home Financials are based on the most recent Mortgage that was taken out on this home.
Original Mortgage
$215,000
Outstanding Balance
$130,273
Interest Rate
6.37%
Mortgage Type
Purchase Money Mortgage
Estimated Equity
$874,551
Purchase Details
Closed on
Jun 15, 2007
Sold by
Urbans Llc
Bought by
Smith Demian
Home Financials for this Owner
Home Financials are based on the most recent Mortgage that was taken out on this home.
Original Mortgage
$215,000
Outstanding Balance
$130,273
Interest Rate
6.37%
Mortgage Type
Purchase Money Mortgage
Estimated Equity
$874,551
Create a Home Valuation Report for This Property
The Home Valuation Report is an in-depth analysis detailing your home's value as well as a comparison with similar homes in the area
Home Values in the Area
Average Home Value in this Area
Purchase History
| Date | Buyer | Sale Price | Title Company |
|---|---|---|---|
| Smith Demian | -- | None Available | |
| Smith Demian | -- | Security Title | |
| Smith Demian | -- | None Available | |
| Smith Demian | $515,000 | Metro Denver Title Llc |
Source: Public Records
Mortgage History
| Date | Status | Borrower | Loan Amount |
|---|---|---|---|
| Open | Smith Demian | $215,000 |
Source: Public Records
Tax History
| Year | Tax Paid | Tax Assessment Tax Assessment Total Assessment is a certain percentage of the fair market value that is determined by local assessors to be the total taxable value of land and additions on the property. | Land | Improvement |
|---|---|---|---|---|
| 2025 | $5,457 | $74,280 | $13,380 | $13,380 |
| 2024 | $5,457 | $68,900 | $8,280 | $60,620 |
| 2023 | $5,339 | $68,900 | $8,280 | $60,620 |
| 2022 | $4,413 | $55,490 | $12,410 | $43,080 |
| 2021 | $4,260 | $57,090 | $12,770 | $44,320 |
| 2020 | $3,966 | $53,460 | $11,180 | $42,280 |
| 2019 | $3,855 | $53,460 | $11,180 | $42,280 |
| 2018 | $3,852 | $49,790 | $8,840 | $40,950 |
| 2017 | $3,841 | $49,790 | $8,840 | $40,950 |
| 2016 | $4,152 | $50,910 | $8,000 | $42,910 |
| 2015 | $3,977 | $50,910 | $8,000 | $42,910 |
| 2014 | $3,273 | $39,410 | $6,543 | $32,867 |
Source: Public Records
Map
Nearby Homes
- 2423 Glenarm Place
- 2347 Glenarm Place Unit 2347
- 2350 Tremont Place Unit 6
- 2546 Glenarm Place
- 2411 California St
- 2200 Tremont Place Unit 5
- 2529 California St
- 2329 N Emerson St
- 100 Park Ave W Unit 408
- 100 Park Ave W Unit 405
- 100 Park Ave W Unit 908
- 100 Park Ave W Unit 606
- 100 Park Ave W Unit 604
- 2516 N Clarkson St
- 2533 N Emerson St
- 422 21st St
- 2711 Welton St Unit 201
- 1950 N Logan St Unit 411
- 1950 N Logan St Unit 708
- 1950 N Logan St Unit 408
- 461 24th St
- 451 24th St
- 2410 Glenarm Place
- 441 24th St
- 2414 Glenarm Place
- 2422 Glenarm Place
- 431 24th St
- 2401 Glenarm Place Unit 104
- 2401 Glenarm Place Unit 303
- 2401 Glenarm Place Unit 203
- 2424 Glenarm Place
- 505 24th St Unit 305
- 505 24th St Unit 304
- 505 24th St Unit 303
- 505 24th St Unit 302
- 505 24th St Unit 301
- 505 24th St Unit 205
- 505 24th St Unit 204
- 505 24th St Unit 203
- 505 24th St Unit 202
Your Personal Tour Guide
Ask me questions while you tour the home.