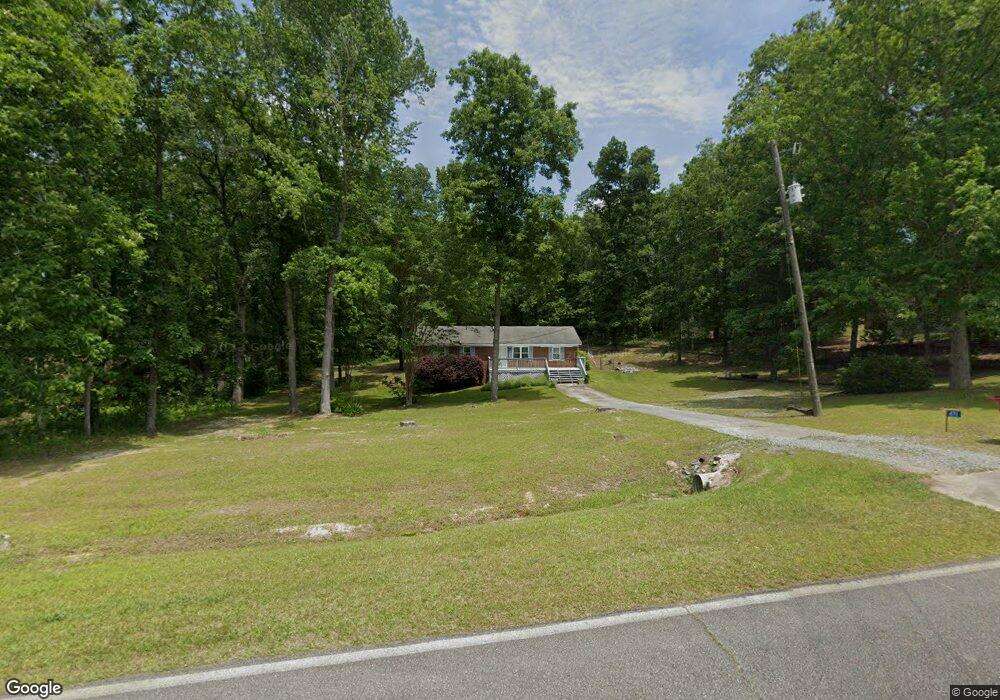
471 Chapman Rd Macon, GA 31211
Estimated Value: $173,000 - $219,000
Studio
1
Bath
1,726
Sq Ft
$110/Sq Ft
Est. Value
About This Home
This home is located at 471 Chapman Rd, Macon, GA 31211 and is currently estimated at $190,236, approximately $110 per square foot. 471 Chapman Rd is a home located in Jones County with nearby schools including Mattie Wells Elementary School, Clifton Ridge Middle School, and Jones County High School.
Ownership History
Date
Name
Owned For
Owner Type
Purchase Details
Closed on
Jun 23, 2016
Sold by
Pierce Cecil S
Bought by
Pierce Tamera
Current Estimated Value
Purchase Details
Closed on
May 14, 2009
Sold by
All American Property Inve
Bought by
Pierce Tamera
Home Financials for this Owner
Home Financials are based on the most recent Mortgage that was taken out on this home.
Original Mortgage
$85,424
Interest Rate
4.81%
Mortgage Type
FHA
Purchase Details
Closed on
Jul 28, 2008
Sold by
Bank Of New York Trust Co
Bought by
All American Property Investor
Purchase Details
Closed on
Apr 1, 2008
Sold by
Howard Dion J
Bought by
The Bank Of New York Trust Co
Purchase Details
Closed on
Feb 23, 2005
Sold by
Hester Janet M
Bought by
Howard Dion J
Home Financials for this Owner
Home Financials are based on the most recent Mortgage that was taken out on this home.
Original Mortgage
$85,000
Interest Rate
8.84%
Mortgage Type
New Conventional
Create a Home Valuation Report for This Property
The Home Valuation Report is an in-depth analysis detailing your home's value as well as a comparison with similar homes in the area
Purchase History
| Date | Buyer | Sale Price | Title Company |
|---|---|---|---|
| Pierce Tamera | -- | -- | |
| Pierce Tamera | $87,000 | -- | |
| Pierce Tamera | $87,000 | -- | |
| All American Property Investor | $43,000 | -- | |
| The Bank Of New York Trust Co | $85,000 | -- | |
| Howard Dion J | $85,000 | -- |
Source: Public Records
Mortgage History
| Date | Status | Borrower | Loan Amount |
|---|---|---|---|
| Previous Owner | Pierce Tamera | $85,424 | |
| Previous Owner | Howard Dion J | $85,000 |
Source: Public Records
Tax History
| Year | Tax Paid | Tax Assessment Tax Assessment Total Assessment is a certain percentage of the fair market value that is determined by local assessors to be the total taxable value of land and additions on the property. | Land | Improvement |
|---|---|---|---|---|
| 2025 | $1,672 | $54,648 | $8,570 | $46,078 |
| 2023 | $763 | $42,279 | $6,592 | $35,687 |
| 2022 | $1,245 | $38,358 | $6,130 | $32,228 |
| 2021 | $1,246 | $38,358 | $6,130 | $32,228 |
| 2020 | $1,247 | $38,358 | $6,130 | $32,228 |
| 2019 | $1,247 | $38,358 | $6,130 | $32,228 |
| 2018 | $1,247 | $38,358 | $6,130 | $32,228 |
| 2017 | $1,247 | $38,358 | $6,130 | $32,228 |
| 2016 | $1,247 | $38,358 | $6,130 | $32,228 |
| 2015 | $1,176 | $38,359 | $6,130 | $32,228 |
| 2014 | $1,089 | $38,359 | $6,130 | $32,228 |
Source: Public Records
Map
Nearby Homes
- 144 Graystone Cir
- 318 Graystone Pointe Dr
- 894 Chapman Dr
- 906 Chapman Dr
- 906 Chapman Dr Unit 46
- 912 Chapman Dr
- 912 Chapman Dr Unit 45
- 123 Chapel Hill Cir
- 120 Chapman Ridge Lot #40 Rd
- 936 Chapman Dr
- 111 Haylie Ct
- 104 Haylie Ct
- 106 Haylie Ct
- 140 Chapman Ridge Rd
- 168 Chapman Ridge Rd
- 168 Chapman Ridge Rd Unit 28
- 224 Rebel Dr
- 612 Kimberly Ct
- 180 Rebel Dr
- 190 Chapman Ridge Lot 22 Rd
- 465 Chapman Rd
- 127 Graybone Ct
- 485 Chapman Rd
- 459 Chapman Rd
- 466 Chapman Rd
- 121 Graybone Ct
- 480 Chapman Rd
- 115 Graybone Ct
- 460 Chapman Rd
- 206 Graystone Cir
- 491 Chapman Rd
- 116 Graybone St
- 198 Graystone Cir
- 116 Graybone Ct
- 486 Chapman Rd
- 110 Graybone Ct
- 124 Graybone Ct
- 501 Chapman Rd
- 119 Graybone Ct
- 104 Graybone Ct
Your Personal Tour Guide
Ask me questions while you tour the home.