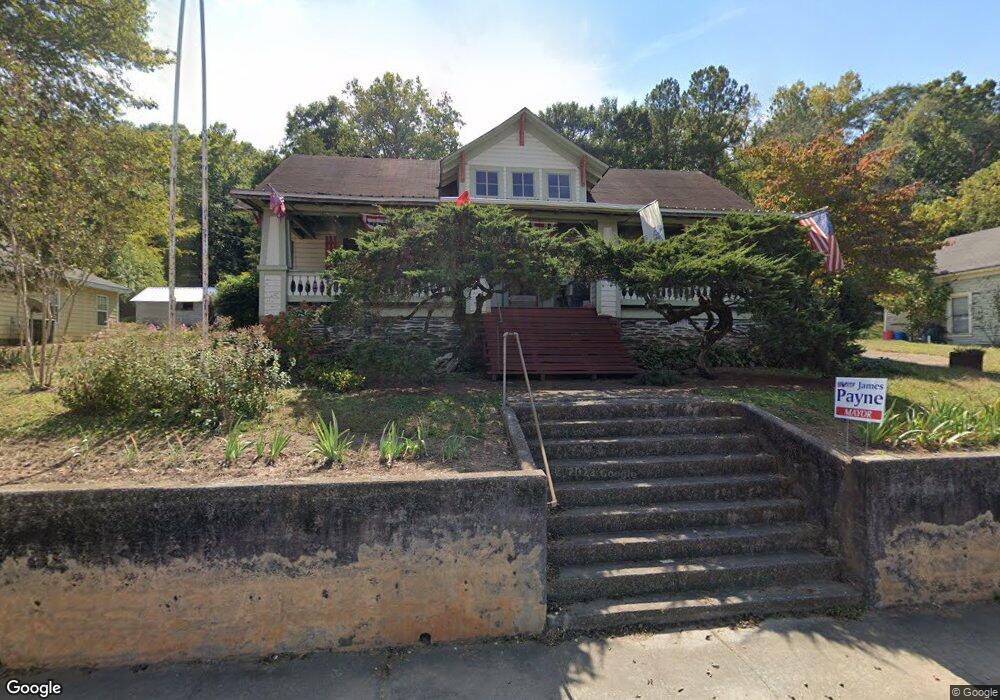
471 E Elm St Rockmart, GA 30153
Estimated Value: $187,000 - $253,000
2
Beds
2
Baths
2,084
Sq Ft
$106/Sq Ft
Est. Value
About This Home
This home is located at 471 E Elm St, Rockmart, GA 30153 and is currently estimated at $219,919, approximately $105 per square foot. 471 E Elm St is a home located in Polk County with nearby schools including Rockmart Middle School.
Ownership History
Date
Name
Owned For
Owner Type
Purchase Details
Closed on
Mar 6, 2007
Sold by
Moore Rosa C
Bought by
Moore Kenneth H
Current Estimated Value
Home Financials for this Owner
Home Financials are based on the most recent Mortgage that was taken out on this home.
Original Mortgage
$90,500
Interest Rate
6.22%
Mortgage Type
New Conventional
Purchase Details
Closed on
Feb 3, 1979
Sold by
White J S Mrs
Bought by
Moore Kenneth H
Purchase Details
Closed on
Nov 15, 1929
Bought by
White J S Mrs
Create a Home Valuation Report for This Property
The Home Valuation Report is an in-depth analysis detailing your home's value as well as a comparison with similar homes in the area
Home Values in the Area
Average Home Value in this Area
Purchase History
| Date | Buyer | Sale Price | Title Company |
|---|---|---|---|
| Moore Kenneth H | -- | -- | |
| Moore Kenneth H | -- | -- | |
| White J S Mrs | -- | -- |
Source: Public Records
Mortgage History
| Date | Status | Borrower | Loan Amount |
|---|---|---|---|
| Closed | Moore Kenneth H | $90,500 |
Source: Public Records
Tax History
| Year | Tax Paid | Tax Assessment Tax Assessment Total Assessment is a certain percentage of the fair market value that is determined by local assessors to be the total taxable value of land and additions on the property. | Land | Improvement |
|---|---|---|---|---|
| 2025 | $1,851 | $75,400 | $7,200 | $68,200 |
| 2024 | $1,749 | $75,400 | $7,200 | $68,200 |
| 2023 | $1,091 | $47,058 | $4,752 | $42,306 |
| 2022 | $645 | $40,568 | $4,752 | $35,816 |
| 2021 | $653 | $40,568 | $4,752 | $35,816 |
| 2020 | $655 | $40,568 | $4,752 | $35,816 |
| 2019 | $620 | $36,426 | $4,046 | $32,380 |
| 2018 | $609 | $35,428 | $4,046 | $31,382 |
| 2017 | $597 | $35,428 | $4,046 | $31,382 |
| 2016 | $566 | $34,310 | $2,927 | $31,382 |
| 2015 | $587 | $35,036 | $2,927 | $32,109 |
| 2014 | $497 | $31,654 | $4,841 | $26,813 |
Source: Public Records
Map
Nearby Homes
- 20 Clemons Dr
- 66 Ridgewood Dr
- 206 Howard St
- 509 College St
- 244 S Piedmont Ave
- 806 Fairview Rd
- 530 Hogue Ave
- 361 Atlanta Hwy
- 540 N Marble St
- 97 Sycamore St
- 600 Oakcrest Dr
- 45 Plainview St
- 232 Litchfield St
- 179 Sycamore St
- 20 Morgan St
- 2001 1st Ave
- 118 Whitley Crossing
- 1012 Fairview Rd
- 2005 1st Ave
- 300 Church St
Your Personal Tour Guide
Ask me questions while you tour the home.