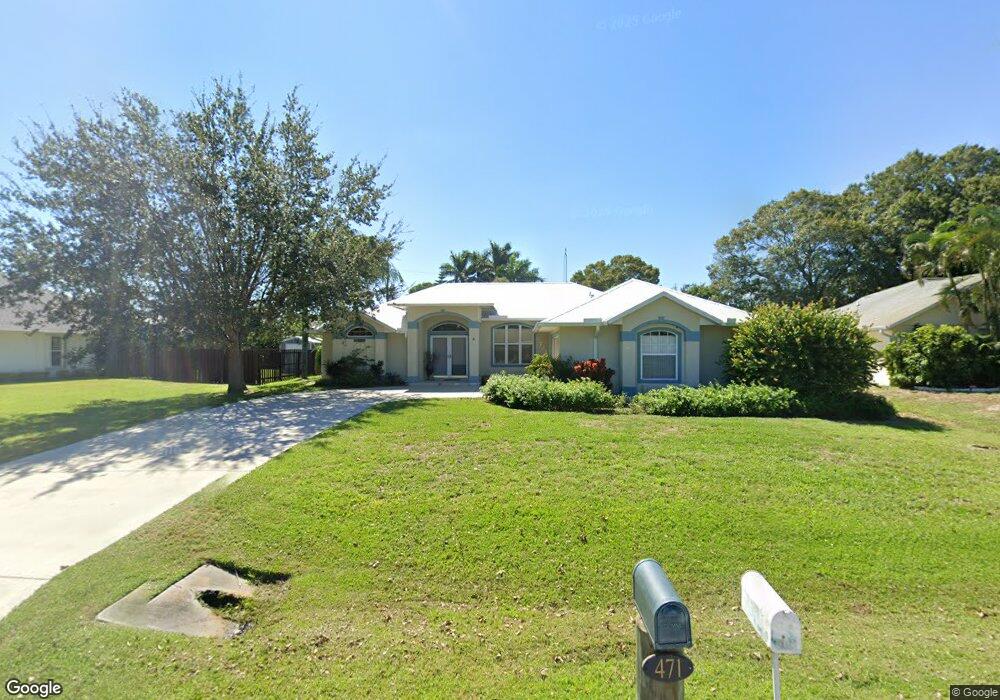
471 Mango Ave Sebastian, FL 32958
Sebastian Highlands NeighborhoodEstimated Value: $322,866 - $388,000
3
Beds
2
Baths
1,797
Sq Ft
$195/Sq Ft
Est. Value
About This Home
This home is located at 471 Mango Ave, Sebastian, FL 32958 and is currently estimated at $349,717, approximately $194 per square foot. 471 Mango Ave is a home located in Indian River County with nearby schools including Sebastian Elementary School, Sebastian River Middle School, and Sebastian River High School.
Ownership History
Date
Name
Owned For
Owner Type
Purchase Details
Closed on
Oct 31, 2023
Sold by
Pinsky-Humphrey Edith L
Bought by
Pinsky-Humphrey Edith L and Insantino Dion Sebastian
Current Estimated Value
Purchase Details
Closed on
Sep 23, 2014
Sold by
Pinsky Edith L and Pinsky Humphrey Edith L
Bought by
Pinsky Humphrey Edith L
Purchase Details
Closed on
Jun 30, 2006
Sold by
Fiorilli Pasquale and Fiorilli Elvyra
Bought by
Pinsky Edith L and Humphrey David
Home Financials for this Owner
Home Financials are based on the most recent Mortgage that was taken out on this home.
Original Mortgage
$95,000
Interest Rate
6.6%
Mortgage Type
Purchase Money Mortgage
Purchase Details
Closed on
Feb 15, 2002
Sold by
Fiorilli Pasquale and Fiorilli Elvyra
Bought by
Fiorilli Pasquale and Fiorilli Elvrya
Purchase Details
Closed on
Dec 29, 1999
Sold by
Boney Joseph A and Boney Kay A
Bought by
Fiorilli Pasquale and Fiorilli Elvyra
Create a Home Valuation Report for This Property
The Home Valuation Report is an in-depth analysis detailing your home's value as well as a comparison with similar homes in the area
Home Values in the Area
Average Home Value in this Area
Purchase History
| Date | Buyer | Sale Price | Title Company |
|---|---|---|---|
| Pinsky-Humphrey Edith L | -- | None Listed On Document | |
| Pinsky Humphrey Edith L | -- | Attorney | |
| Pinsky Edith L | $180,000 | Professional Title | |
| Fiorilli Pasquale | -- | -- | |
| Fiorilli Pasquale | $10,000 | -- |
Source: Public Records
Mortgage History
| Date | Status | Borrower | Loan Amount |
|---|---|---|---|
| Previous Owner | Pinsky Edith L | $95,000 |
Source: Public Records
Tax History
| Year | Tax Paid | Tax Assessment Tax Assessment Total Assessment is a certain percentage of the fair market value that is determined by local assessors to be the total taxable value of land and additions on the property. | Land | Improvement |
|---|---|---|---|---|
| 2025 | $3,665 | $239,790 | -- | -- |
| 2024 | $2,784 | $239,790 | -- | -- |
| 2023 | $2,784 | $226,244 | $0 | $0 |
| 2022 | $2,799 | $219,654 | $37,400 | $182,254 |
| 2021 | $1,732 | $130,628 | $0 | $0 |
| 2020 | $1,724 | $128,825 | $0 | $0 |
| 2019 | $1,694 | $125,929 | $0 | $0 |
| 2018 | $1,692 | $123,581 | $0 | $0 |
| 2017 | $1,623 | $121,040 | $0 | $0 |
| 2016 | $1,621 | $118,550 | $0 | $0 |
| 2015 | $1,328 | $117,730 | $0 | $0 |
| 2014 | $1,168 | $93,030 | $0 | $0 |
Source: Public Records
Map
Nearby Homes
- 441 Avocado Ave
- 471 Kumquat Ave
- 412 SW Mango Ave
- 337 SW Mango Ave
- 201 Poinciana St
- 122 Coconut St
- 144 Main St
- 418 Easy St
- 572 Orange Ave
- 258 Main St
- 382 Easy St
- 111 Sandcrest Cir
- 433 Briarcliff Cir
- 358 Benschop St
- 221 Briarcliff Cir
- 426 Ash St
- 402 Toledo St
- 215 Briarcliff Cir
- 425 Banyan St
- 502 Park Ave
Your Personal Tour Guide
Ask me questions while you tour the home.