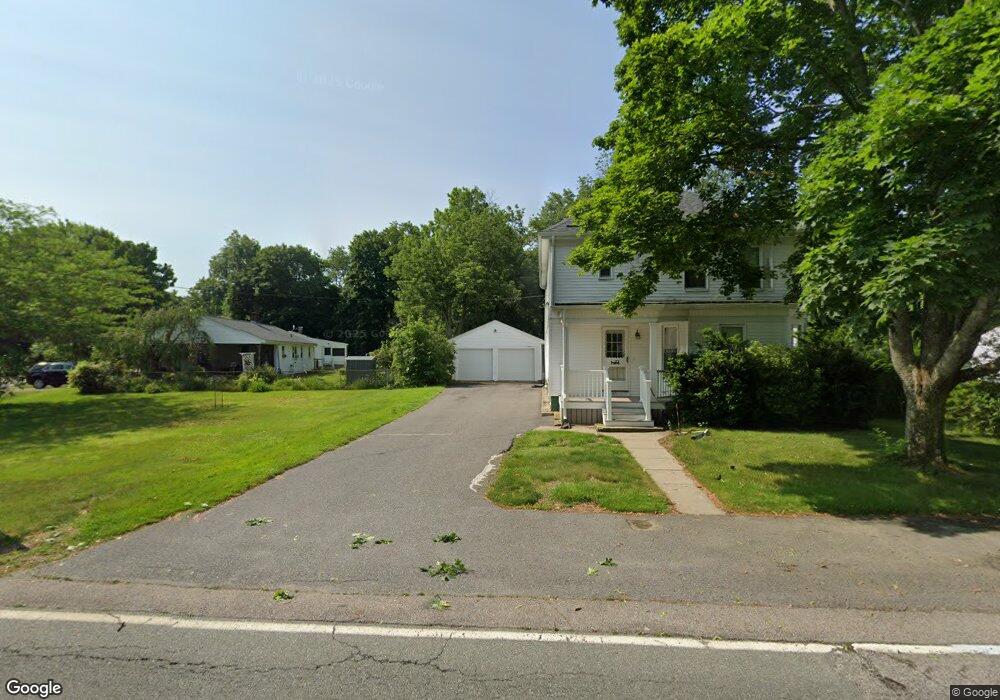
471 Matfield St West Bridgewater, MA 02379
Estimated Value: $539,155 - $662,000
5
Beds
2
Baths
2,052
Sq Ft
$283/Sq Ft
Est. Value
About This Home
This home is located at 471 Matfield St, West Bridgewater, MA 02379 and is currently estimated at $580,289, approximately $282 per square foot. 471 Matfield St is a home located in Plymouth County with nearby schools including Spring Street Elementary School, Howard Elementary School, and Rose L. MacDonald Elementary School.
Ownership History
Date
Name
Owned For
Owner Type
Purchase Details
Closed on
Dec 12, 2008
Sold by
Amg Rt and Gouthro Stephen M
Bought by
Anderson Kevin E and Anderson Michele L
Current Estimated Value
Home Financials for this Owner
Home Financials are based on the most recent Mortgage that was taken out on this home.
Original Mortgage
$250,000
Outstanding Balance
$168,065
Interest Rate
6.49%
Mortgage Type
Purchase Money Mortgage
Estimated Equity
$412,224
Purchase Details
Closed on
Mar 1, 2004
Sold by
Packard Ann C
Bought by
Gouthro Stephen M and Smith Andrew G
Create a Home Valuation Report for This Property
The Home Valuation Report is an in-depth analysis detailing your home's value as well as a comparison with similar homes in the area
Home Values in the Area
Average Home Value in this Area
Purchase History
| Date | Buyer | Sale Price | Title Company |
|---|---|---|---|
| Anderson Kevin E | $300,000 | -- | |
| Gouthro Stephen M | $240,000 | -- |
Source: Public Records
Mortgage History
| Date | Status | Borrower | Loan Amount |
|---|---|---|---|
| Open | Gouthro Stephen M | $250,000 | |
| Previous Owner | Gouthro Stephen M | $10,000 |
Source: Public Records
Tax History Compared to Growth
Tax History
| Year | Tax Paid | Tax Assessment Tax Assessment Total Assessment is a certain percentage of the fair market value that is determined by local assessors to be the total taxable value of land and additions on the property. | Land | Improvement |
|---|---|---|---|---|
| 2025 | $6,458 | $472,400 | $206,900 | $265,500 |
| 2024 | $6,208 | $438,100 | $187,600 | $250,500 |
| 2023 | $5,813 | $378,200 | $162,500 | $215,700 |
| 2022 | $5,476 | $337,600 | $152,800 | $184,800 |
| 2021 | $12,014 | $337,600 | $152,800 | $184,800 |
| 2020 | $0 | $337,600 | $152,800 | $184,800 |
| 2019 | $5,400 | $326,700 | $152,800 | $173,900 |
| 2018 | $4,736 | $302,100 | $145,100 | $157,000 |
| 2017 | $4,991 | $281,500 | $131,500 | $150,000 |
| 2016 | $4,900 | $272,200 | $122,200 | $150,000 |
| 2015 | $4,851 | $272,400 | $122,200 | $150,200 |
| 2014 | $4,492 | $272,400 | $122,200 | $150,200 |
Source: Public Records
Map
Nearby Homes
- 467 Matfield St
- 15 Thayer Ave
- 466 Matfield St
- 461 Matfield St Unit 463
- 00 Thayer Ave
- 474 Matfield St
- 470 Matfield St
- 470 Matfield St
- 17 Thayer Ave
- 485 Matfield St
- 462 Matfield St
- 458 Matfield St
- 451 Matfield St
- 19 Thayer Ave
- 448 Matfield St
- 448 Matfield St Unit 1
- 124 Belmont St
- 2 Michelle Way
- 4 Michelle Way
- 127 Belmont St