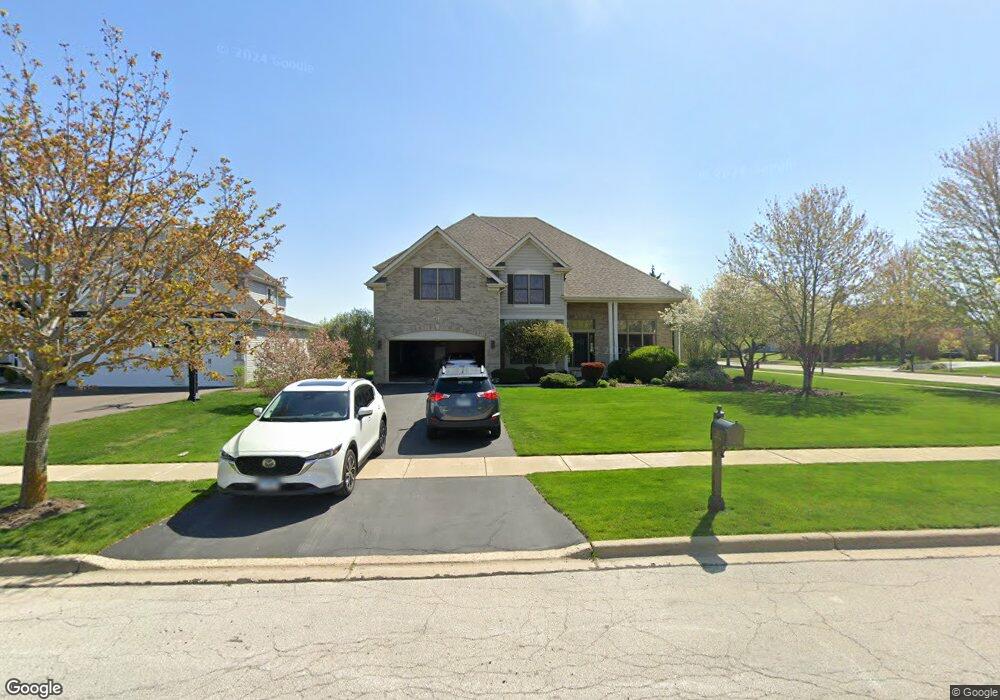
471 Mount Ct North Aurora, IL 60542
Estimated Value: $639,951 - $720,000
4
Beds
3
Baths
3,900
Sq Ft
$176/Sq Ft
Est. Value
About This Home
This home is located at 471 Mount Ct, North Aurora, IL 60542 and is currently estimated at $685,738, approximately $175 per square foot. 471 Mount Ct is a home located in Kane County with nearby schools including Goodwin Elementary School, Jewel Middle School, and West Aurora High School.
Ownership History
Date
Name
Owned For
Owner Type
Purchase Details
Closed on
Sep 22, 2023
Sold by
Patrick J Conley Living Trust
Bought by
Kathleen M Conley Living Trust and Conley
Current Estimated Value
Purchase Details
Closed on
Sep 1, 2010
Sold by
Moreno Steven S and Moreno Sally M
Bought by
Conley Patrick J and Conley Kathleen M
Home Financials for this Owner
Home Financials are based on the most recent Mortgage that was taken out on this home.
Original Mortgage
$95,000
Interest Rate
4.49%
Mortgage Type
New Conventional
Purchase Details
Closed on
Jun 1, 2005
Sold by
Gladstone Acquisitions Llc
Bought by
Moreno Steven S and Moreno Sally M
Home Financials for this Owner
Home Financials are based on the most recent Mortgage that was taken out on this home.
Original Mortgage
$435,450
Interest Rate
5.25%
Mortgage Type
Purchase Money Mortgage
Create a Home Valuation Report for This Property
The Home Valuation Report is an in-depth analysis detailing your home's value as well as a comparison with similar homes in the area
Home Values in the Area
Average Home Value in this Area
Purchase History
| Date | Buyer | Sale Price | Title Company |
|---|---|---|---|
| Kathleen M Conley Living Trust | -- | None Listed On Document | |
| Conley Patrick J | $340,000 | Fidelity National Title | |
| Moreno Steven S | $544,500 | Chicago Title Insurance Comp |
Source: Public Records
Mortgage History
| Date | Status | Borrower | Loan Amount |
|---|---|---|---|
| Previous Owner | Conley Patrick J | $95,000 | |
| Previous Owner | Moreno Steven S | $435,450 | |
| Closed | Moreno Steven S | $77,000 |
Source: Public Records
Tax History
| Year | Tax Paid | Tax Assessment Tax Assessment Total Assessment is a certain percentage of the fair market value that is determined by local assessors to be the total taxable value of land and additions on the property. | Land | Improvement |
|---|---|---|---|---|
| 2024 | $11,469 | $168,573 | $24,562 | $144,011 |
| 2023 | $11,147 | $152,998 | $22,293 | $130,705 |
| 2022 | $10,907 | $142,989 | $20,835 | $122,154 |
| 2021 | $10,594 | $135,612 | $19,760 | $115,852 |
| 2020 | $10,553 | $133,005 | $19,380 | $113,625 |
| 2019 | $10,663 | $128,297 | $18,694 | $109,603 |
| 2018 | $10,566 | $123,410 | $17,982 | $105,428 |
| 2017 | $11,048 | $119,340 | $17,389 | $101,951 |
| 2016 | $11,034 | $115,865 | $16,883 | $98,982 |
| 2015 | $9,288 | $113,227 | $16,499 | $96,728 |
| 2014 | $9,288 | $109,663 | $15,980 | $93,683 |
| 2013 | $9,288 | $107,523 | $15,668 | $91,855 |
Source: Public Records
Map
Nearby Homes
- 413 N Sycamore Ln
- 357 Pheasant Hill Dr
- 444 Prairie Ridge Ln
- 448 Prairie Ridge Ln
- 459 Prairie Ridge Ln
- 344 Timber Oaks Dr
- 346 Timber Oaks Dr
- 451 Pheasant Hill Dr
- 406 Juniper Dr
- 537 Moose Lake Ave
- 307 Hill Ave
- 208 W State St
- 28 S Willow Way
- 2S904 Heritage Glen Ct
- 10 S Grant St
- 111 Hidden Creek Ln Unit 286
- 81 Parkside Ct Unit 2
- 210 Linn Ct Unit D
- 320 Sussex Ln
- 933 Wilkinson Ln
- 475 Mount Ct
- 479 Mount Ct
- 450 Fox Crossing Ave
- 454 Fox Crossing Ave
- 414 Prairie Ridge Ln Unit 2
- 472 Mount Ct
- 458 Fox Crossing Ave
- 476 Mount Ct
- 483 Mount Ct
- 480 Mount Ct
- 410 Prairie Ridge Ln
- 462 Fox Crossing Ave
- 452 Prairie Ridge Ln
- 484 Mount Ct
- 406 Prairie Ridge Ln
- 487 Mount Ct
- 466 Fox Crossing Ave
- 344 Pheasant Hill Dr
- 340 Pheasant Hill Dr
- 488 Mount Ct
Your Personal Tour Guide
Ask me questions while you tour the home.