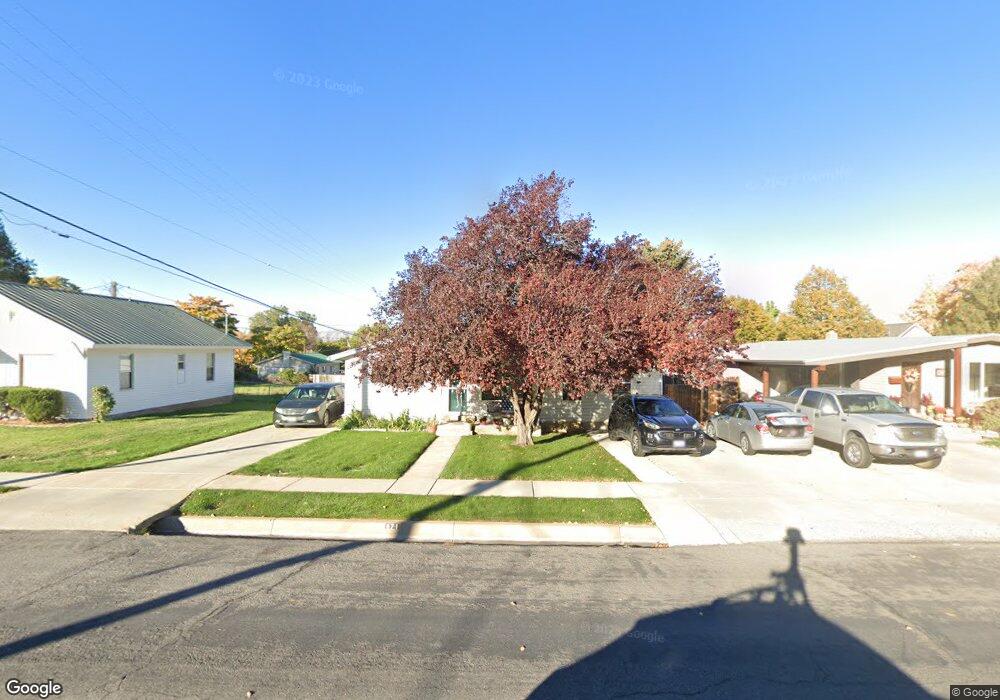
471 N 600 E Spanish Fork, UT 84660
Estimated Value: $426,536 - $468,000
4
Beds
3
Baths
1,850
Sq Ft
$242/Sq Ft
Est. Value
About This Home
This home is located at 471 N 600 E, Spanish Fork, UT 84660 and is currently estimated at $448,179, approximately $242 per square foot. 471 N 600 E is a home located in Utah County with nearby schools including Park Elementary School, Spanish Fork Jr High School, and Spanish Fork High School.
Ownership History
Date
Name
Owned For
Owner Type
Purchase Details
Closed on
Jan 19, 2005
Sold by
Henrichsen Roy Eldon and Henrichsen Sharon
Bought by
Henrichsen Roy E and Henrichsen Sharon P
Current Estimated Value
Purchase Details
Closed on
Jul 13, 2000
Sold by
Daley Gordon L and Daley Eileen H
Bought by
Henrichsen Roy Eldon and Henrichsen Sharon
Home Financials for this Owner
Home Financials are based on the most recent Mortgage that was taken out on this home.
Original Mortgage
$105,750
Outstanding Balance
$38,698
Interest Rate
8.55%
Estimated Equity
$409,481
Purchase Details
Closed on
Jun 21, 1996
Sold by
Daley Orin D and Daley Margaret C
Bought by
Daley Gordon L and Daley Eileen H
Home Financials for this Owner
Home Financials are based on the most recent Mortgage that was taken out on this home.
Original Mortgage
$99,000
Interest Rate
8.03%
Mortgage Type
Seller Take Back
Create a Home Valuation Report for This Property
The Home Valuation Report is an in-depth analysis detailing your home's value as well as a comparison with similar homes in the area
Home Values in the Area
Average Home Value in this Area
Purchase History
| Date | Buyer | Sale Price | Title Company |
|---|---|---|---|
| Henrichsen Roy E | -- | -- | |
| Henrichsen Roy Eldon | -- | Pro Title & Escrow Inc | |
| Daley Gordon L | -- | -- |
Source: Public Records
Mortgage History
| Date | Status | Borrower | Loan Amount |
|---|---|---|---|
| Open | Henrichsen Roy Eldon | $105,750 | |
| Previous Owner | Daley Gordon L | $99,000 |
Source: Public Records
Tax History
| Year | Tax Paid | Tax Assessment Tax Assessment Total Assessment is a certain percentage of the fair market value that is determined by local assessors to be the total taxable value of land and additions on the property. | Land | Improvement |
|---|---|---|---|---|
| 2025 | $1,947 | $230,945 | -- | -- |
| 2024 | $1,947 | $200,640 | $0 | $0 |
| 2023 | $1,957 | $201,905 | $0 | $0 |
| 2022 | $1,948 | $197,120 | $0 | $0 |
| 2021 | $1,729 | $279,900 | $86,900 | $193,000 |
| 2020 | $1,565 | $246,300 | $72,400 | $173,900 |
| 2019 | $1,350 | $223,600 | $72,400 | $151,200 |
| 2018 | $1,274 | $203,900 | $72,400 | $131,500 |
| 2017 | $1,225 | $105,380 | $0 | $0 |
| 2016 | $1,094 | $92,895 | $0 | $0 |
| 2015 | $986 | $82,720 | $0 | $0 |
| 2014 | $903 | $76,065 | $0 | $0 |
Source: Public Records
Map
Nearby Homes
- 679 E 400 N
- 270 N 500 E
- 284 N 400 E
- 265 N 800 E
- 330 E 700 N
- 440 N 200 E
- 482 E 900 N
- 570 N 100 E
- 284 N 1000 E
- 314 N 1070 E
- 306 N 1070 E
- 306 N 1070 E Unit 17
- 274 N 1070 E Unit 14
- 299 N 1070 E Unit 8
- 212 N 1070 E Unit 9
- 224 N 1070 E Unit 10
- 1074 E 660 N
- 1050 E 800 N Unit 1
- 1050 E 800 N Unit 5
- 235 E 900 N
Your Personal Tour Guide
Ask me questions while you tour the home.