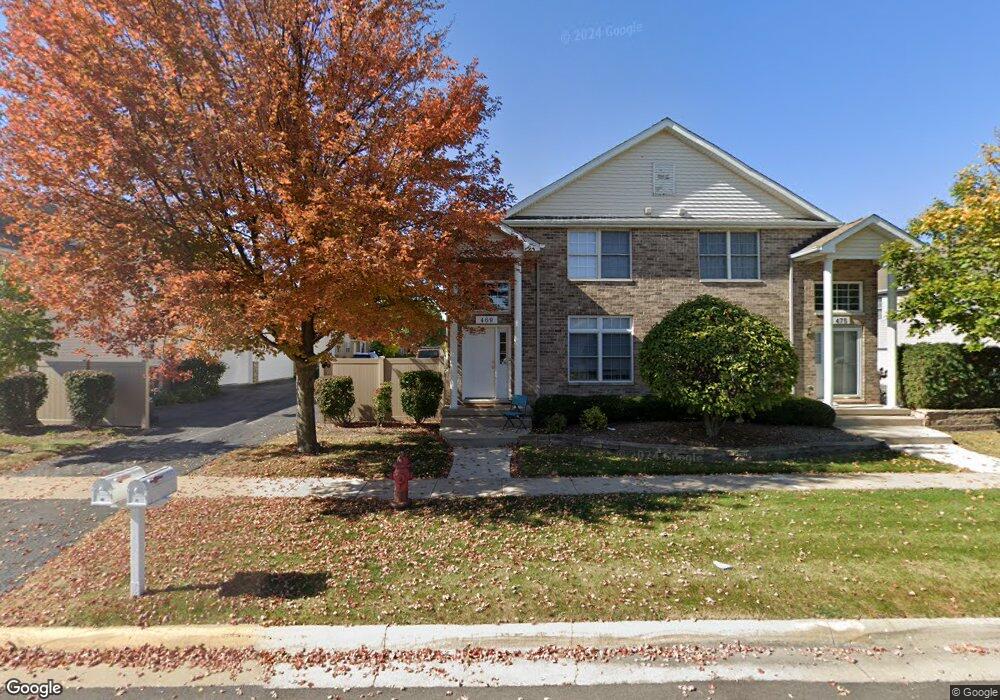
471 N Charles St Unit 4 Cortland, IL 60112
Estimated Value: $197,605 - $227,000
3
Beds
2
Baths
1,280
Sq Ft
$163/Sq Ft
Est. Value
About This Home
This home is located at 471 N Charles St Unit 4, Cortland, IL 60112 and is currently estimated at $209,151, approximately $163 per square foot. 471 N Charles St Unit 4 is a home located in DeKalb County with nearby schools including Cortland Elementary School, Huntley Middle School, and De Kalb High School.
Ownership History
Date
Name
Owned For
Owner Type
Purchase Details
Closed on
Jan 24, 2017
Sold by
Neal Adam and Neal Karla
Bought by
Neal Laen A
Current Estimated Value
Home Financials for this Owner
Home Financials are based on the most recent Mortgage that was taken out on this home.
Original Mortgage
$75,050
Outstanding Balance
$62,016
Interest Rate
4.13%
Mortgage Type
New Conventional
Estimated Equity
$147,135
Purchase Details
Closed on
Apr 21, 2011
Sold by
Williams John
Bought by
Neal Adam and Neal Karla
Home Financials for this Owner
Home Financials are based on the most recent Mortgage that was taken out on this home.
Original Mortgage
$82,900
Interest Rate
4.77%
Mortgage Type
New Conventional
Purchase Details
Closed on
Oct 5, 2010
Sold by
Us Bank Na
Bought by
Williams John
Purchase Details
Closed on
May 20, 2010
Sold by
Dekalb County Sheriff
Bought by
Us Bank Na Trust
Create a Home Valuation Report for This Property
The Home Valuation Report is an in-depth analysis detailing your home's value as well as a comparison with similar homes in the area
Home Values in the Area
Average Home Value in this Area
Purchase History
| Date | Buyer | Sale Price | Title Company |
|---|---|---|---|
| Neal Laen A | $79,000 | -- | |
| Neal Adam | $79,000 | -- | |
| Williams John | $58,500 | -- | |
| Us Bank Na Trust | -- | -- |
Source: Public Records
Mortgage History
| Date | Status | Borrower | Loan Amount |
|---|---|---|---|
| Open | Neal Laen A | $75,050 | |
| Previous Owner | Neal Adam | $82,900 |
Source: Public Records
Tax History Compared to Growth
Tax History
| Year | Tax Paid | Tax Assessment Tax Assessment Total Assessment is a certain percentage of the fair market value that is determined by local assessors to be the total taxable value of land and additions on the property. | Land | Improvement |
|---|---|---|---|---|
| 2024 | $3,933 | $52,759 | $5,271 | $47,488 |
| 2023 | $3,933 | $47,965 | $4,931 | $43,034 |
| 2022 | $3,963 | $45,777 | $4,706 | $41,071 |
| 2021 | $4,617 | $43,585 | $4,481 | $39,104 |
| 2020 | $4,627 | $42,225 | $4,341 | $37,884 |
| 2019 | $4,498 | $40,453 | $4,159 | $36,294 |
| 2018 | $3,772 | $32,949 | $3,933 | $29,016 |
| 2017 | $2,554 | $27,454 | $3,744 | $23,710 |
| 2016 | $2,411 | $25,803 | $3,519 | $22,284 |
| 2015 | -- | $24,231 | $3,305 | $20,926 |
| 2014 | -- | $23,322 | $3,181 | $20,141 |
| 2013 | -- | $24,168 | $3,296 | $20,872 |
Source: Public Records
Map
Nearby Homes
- 437 N Charles St Unit 7
- 353 N Aspen Dr
- 347 N Aspen Dr
- 341 N Aspen Dr
- 335 N Aspen Dr
- 329 N Aspen Dr
- 42 W Auburndale Ave
- 300 N Aspen Dr
- 94 W Crabapple Ave
- Lot C7 Crabapple Ave
- Lot 2 Stonegate
- 214 N Aspen Dr
- 95 Lots Chestnut Grove
- Lot B5 W Paw Ave
- Lot B6 W Paw Ave
- LOT E7 W Bluebell Ave
- Lot D7 Bluebell
- 241 N Somonauk Rd
- 20 W Sandalwood Ave
- 20 Sandalwood Ave
- 473 N Charles St Unit 4
- 469 N Charles St Unit 4
- 477 N Charles St Unit 4
- 477 N Charles St Unit 1
- 477 N Charles St Unit 477
- 465 N Charles St Unit 5
- 467 N Charles St Unit 5
- 479 N Charles St Unit 4
- 463 N Charles St Unit 5
- 483 N Charles St Unit 4
- 468 N Charles St
- 481 N Charles St Unit 4
- 461 N Charles St Unit 5
- 487 N Charles St Unit 3
- 485 N Charles St Unit 3
- 476 N Charles St
- 457 N Charles St Unit 5
- 459 N Charles St Unit 5
- 491 N Charles St Unit 3
- 460 N Charles St