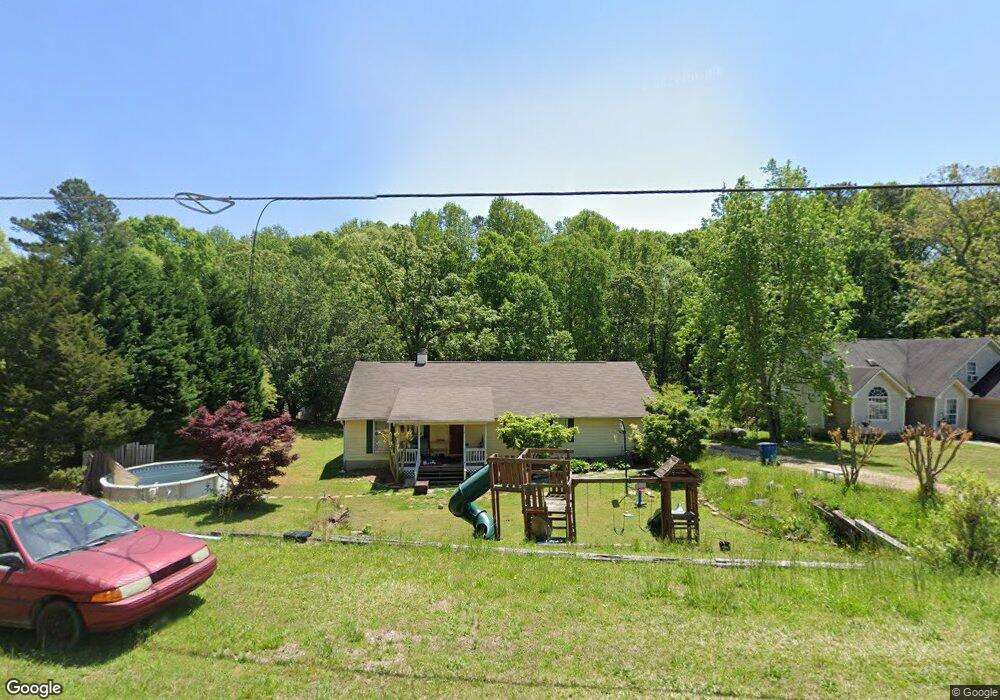
471 Pendergrass Rd Winder, GA 30680
Estimated Value: $329,906 - $379,000
3
Beds
2
Baths
1,800
Sq Ft
$196/Sq Ft
Est. Value
About This Home
This home is located at 471 Pendergrass Rd, Winder, GA 30680 and is currently estimated at $352,727, approximately $195 per square foot. 471 Pendergrass Rd is a home located in Barrow County with nearby schools including Holsenbeck Elementary School, Bear Creek Middle School, and Winder-Barrow High School.
Ownership History
Date
Name
Owned For
Owner Type
Purchase Details
Closed on
Sep 9, 2005
Sold by
Hud
Bought by
Wilson James D
Current Estimated Value
Home Financials for this Owner
Home Financials are based on the most recent Mortgage that was taken out on this home.
Original Mortgage
$110,204
Outstanding Balance
$57,903
Interest Rate
5.86%
Mortgage Type
New Conventional
Estimated Equity
$294,824
Purchase Details
Closed on
May 3, 2005
Sold by
Chase Hm Fin Llc
Bought by
Hud
Purchase Details
Closed on
Apr 30, 2001
Sold by
Household Realty Corp
Bought by
Simpson Danny R and Simpson Sharon J
Home Financials for this Owner
Home Financials are based on the most recent Mortgage that was taken out on this home.
Original Mortgage
$102,350
Interest Rate
6.98%
Mortgage Type
FHA
Purchase Details
Closed on
Sep 5, 2000
Sold by
Carter William D And
Bought by
Household Realty Cor
Purchase Details
Closed on
Jan 5, 1996
Sold by
Carter William D
Bought by
Carter William D And
Purchase Details
Closed on
Oct 5, 1993
Bought by
Federal Home Loan
Create a Home Valuation Report for This Property
The Home Valuation Report is an in-depth analysis detailing your home's value as well as a comparison with similar homes in the area
Home Values in the Area
Average Home Value in this Area
Purchase History
| Date | Buyer | Sale Price | Title Company |
|---|---|---|---|
| Wilson James D | -- | -- | |
| Hud | -- | -- | |
| Chase Hm Fin Llc | $104,681 | -- | |
| Simpson Danny R | $104,000 | -- | |
| Household Realty Cor | -- | -- | |
| Carter William D And | -- | -- | |
| Federal Home Loan | $79,700 | -- |
Source: Public Records
Mortgage History
| Date | Status | Borrower | Loan Amount |
|---|---|---|---|
| Open | Wilson James D | $110,204 | |
| Previous Owner | Simpson Danny R | $102,350 |
Source: Public Records
Tax History
| Year | Tax Paid | Tax Assessment Tax Assessment Total Assessment is a certain percentage of the fair market value that is determined by local assessors to be the total taxable value of land and additions on the property. | Land | Improvement |
|---|---|---|---|---|
| 2025 | $2,087 | $89,717 | $20,336 | $69,381 |
| 2024 | $2,095 | $87,691 | $20,336 | $67,355 |
| 2023 | $1,674 | $87,691 | $20,336 | $67,355 |
| 2022 | $1,653 | $60,608 | $20,336 | $40,272 |
| 2021 | $1,550 | $54,234 | $16,269 | $37,965 |
| 2020 | $1,522 | $53,265 | $15,300 | $37,965 |
| 2019 | $1,445 | $49,894 | $15,300 | $34,594 |
| 2018 | $1,422 | $49,886 | $15,300 | $34,586 |
| 2017 | $1,276 | $43,826 | $15,300 | $28,526 |
| 2016 | $1,220 | $44,200 | $15,300 | $28,900 |
| 2015 | $1,237 | $44,574 | $15,300 | $29,274 |
| 2014 | $1,030 | $37,518 | $7,497 | $30,021 |
| 2013 | -- | $36,173 | $7,497 | $28,676 |
Source: Public Records
Map
Nearby Homes
- 475 Pendergrass Rd
- 466 Pendergrass Rd
- 372 Ashton Way
- 421 Arrowhatchee Dr
- 58 Cedar Bluff
- 547 Hickeria Way
- 615 Gainesville Hwy
- 303 Rooks Rd
- 0 Sims Rd Unit 10674254
- 5 Olevia St
- 457 Banff Dr
- 543 Calgary Downs Dr
- 273 Greystone Ct
- 454 Banff Dr
- 116 Wisteria Dr
- 132 Wisteria Dr
- 450 Banff Dr
- 136 Wisteria Dr
- 448 Banff Dr
- 52 Wisteria Ct
- 457 Pendergrass Rd
- 465 Pendergrass Rd
- 479 Pendergrass Rd
- 472 Pendergrass Rd
- 474 Pendergrass Rd
- 445 Pendergrass Rd
- 493 Pendergrass Rd
- 423 Tabby Ln
- 499 Pendergrass Rd
- 486 Pendergrass Rd
- 450 Pendergrass Rd
- 361 Cedar Valley Trail E
- 374 Cedar Valley Trail E
- 439 Pendergrass Rd
- 444 Pendergrass Rd
- 448 Pendergrass Rd
- 440 Pendergrass Rd
- 464 Pendergrass Rd
- 392 Cedar Valley Trail E
- 416 Tabby Ln
Your Personal Tour Guide
Ask me questions while you tour the home.