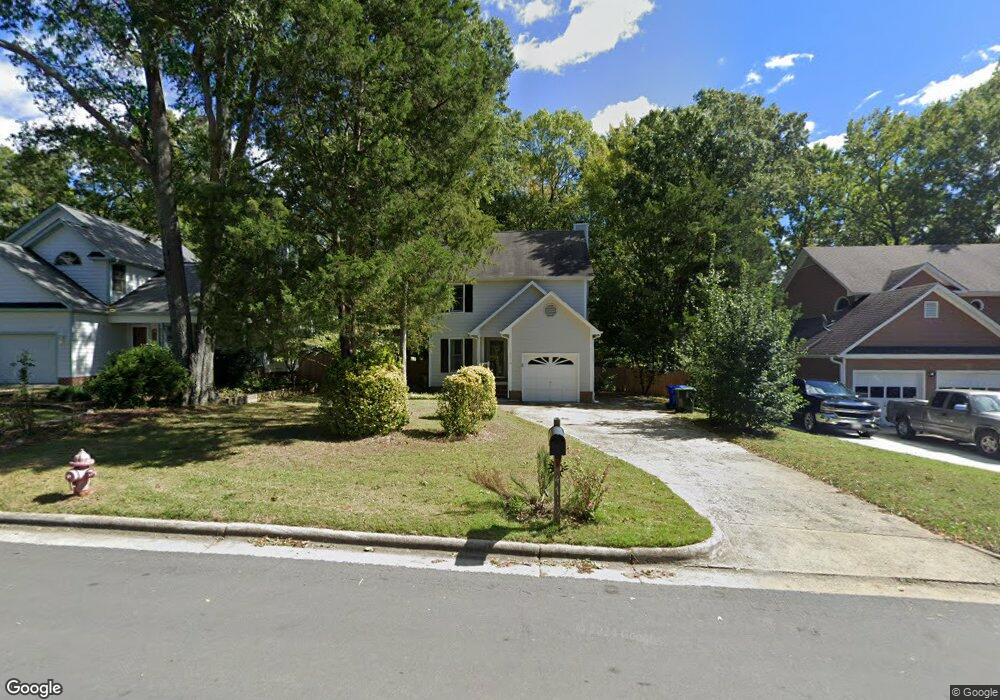
4710 Lazyriver Dr Durham, NC 27712
North Durham NeighborhoodEstimated Value: $359,856 - $378,000
3
Beds
3
Baths
1,495
Sq Ft
$246/Sq Ft
Est. Value
About This Home
This home is located at 4710 Lazyriver Dr, Durham, NC 27712 and is currently estimated at $368,214, approximately $246 per square foot. 4710 Lazyriver Dr is a home located in Durham County with nearby schools including Eno Valley Elementary, George L Carrington Middle, and Northern High School.
Ownership History
Date
Name
Owned For
Owner Type
Purchase Details
Closed on
Jan 23, 2007
Sold by
Cook Tammy K
Bought by
Casey Ryan M and Casey Mary W
Current Estimated Value
Home Financials for this Owner
Home Financials are based on the most recent Mortgage that was taken out on this home.
Original Mortgage
$135,502
Outstanding Balance
$80,388
Interest Rate
6.08%
Mortgage Type
FHA
Estimated Equity
$287,826
Purchase Details
Closed on
Jun 7, 2004
Sold by
Konstance Richard P and Konstance Laura E
Bought by
Cook Tammy K
Home Financials for this Owner
Home Financials are based on the most recent Mortgage that was taken out on this home.
Original Mortgage
$125,000
Interest Rate
5%
Mortgage Type
Purchase Money Mortgage
Purchase Details
Closed on
Jun 10, 1999
Sold by
Telke Scott A and Wife Janelle J
Bought by
Konstance Ii Richard P and Konstance Laura E
Home Financials for this Owner
Home Financials are based on the most recent Mortgage that was taken out on this home.
Original Mortgage
$133,000
Interest Rate
6.5%
Create a Home Valuation Report for This Property
The Home Valuation Report is an in-depth analysis detailing your home's value as well as a comparison with similar homes in the area
Home Values in the Area
Average Home Value in this Area
Purchase History
| Date | Buyer | Sale Price | Title Company |
|---|---|---|---|
| Casey Ryan M | $143,500 | None Available | |
| Cook Tammy K | $146,000 | -- | |
| Konstance Ii Richard P | $133,000 | -- |
Source: Public Records
Mortgage History
| Date | Status | Borrower | Loan Amount |
|---|---|---|---|
| Open | Casey Ryan M | $135,502 | |
| Previous Owner | Cook Tammy K | $125,000 | |
| Previous Owner | Konstance Ii Richard P | $133,000 |
Source: Public Records
Tax History
| Year | Tax Paid | Tax Assessment Tax Assessment Total Assessment is a certain percentage of the fair market value that is determined by local assessors to be the total taxable value of land and additions on the property. | Land | Improvement |
|---|---|---|---|---|
| 2025 | $3,617 | $364,875 | $73,600 | $291,275 |
| 2024 | $2,567 | $184,038 | $38,310 | $145,728 |
| 2023 | $2,411 | $184,038 | $38,310 | $145,728 |
| 2022 | $2,356 | $184,038 | $38,310 | $145,728 |
| 2021 | $2,344 | $184,038 | $38,310 | $145,728 |
| 2020 | $2,289 | $184,038 | $38,310 | $145,728 |
| 2019 | $2,289 | $184,038 | $38,310 | $145,728 |
| 2018 | $2,073 | $152,825 | $25,540 | $127,285 |
| 2017 | $2,058 | $152,825 | $25,540 | $127,285 |
| 2016 | $1,988 | $152,825 | $25,540 | $127,285 |
| 2015 | $1,902 | $137,418 | $30,277 | $107,141 |
| 2014 | $1,902 | $137,418 | $30,277 | $107,141 |
Source: Public Records
Map
Nearby Homes
- 8 Osage Place
- 631 Infinity Rd
- 4311 White Cliff Ln
- 5100 Stardust Dr
- 4802 Seterra Bend
- 6 Timbercreek Ct
- 711 Wheat Mill Rd
- 5422 Whippoorwill St
- 7 Neptune Ct
- 5412 Peppercorn St
- 11 Shelburn Ct
- 5309 Old Well St
- 705 Felicia St
- 601 Weeping Willow Dr
- 601 Crestview Dr
- 809 Felicia St
- 5414 Stanley Rd
- 4907 S Singing Woods Place
- 215 Cheryl Ave
- 2208 Titanium Rock Rd
- 4708 Lazyriver Dr
- 4712 Lazyriver Dr
- 4705 Buttonbush Dr
- 4704 Lazyriver Dr
- 4702 Shadebush Dr
- 4707 Buttonbush Dr
- 4721 Buttonbush Dr
- 4716 Lazyriver Dr
- 4801 Buttonbush Dr
- 4715 Lazyriver Dr
- 4704 Shadebush Dr
- 4703 Shadebush Dr
- 4718 Lazyriver Dr
- 4717 Lazyriver Dr
- 4805 Buttonbush Dr
- 4803 Buttonbush Dr
- 4706 Shadebush Dr
- 4705 Shadebush Dr
- 4719 Lazyriver Dr
- 4704 Buttonbush Dr
Your Personal Tour Guide
Ask me questions while you tour the home.