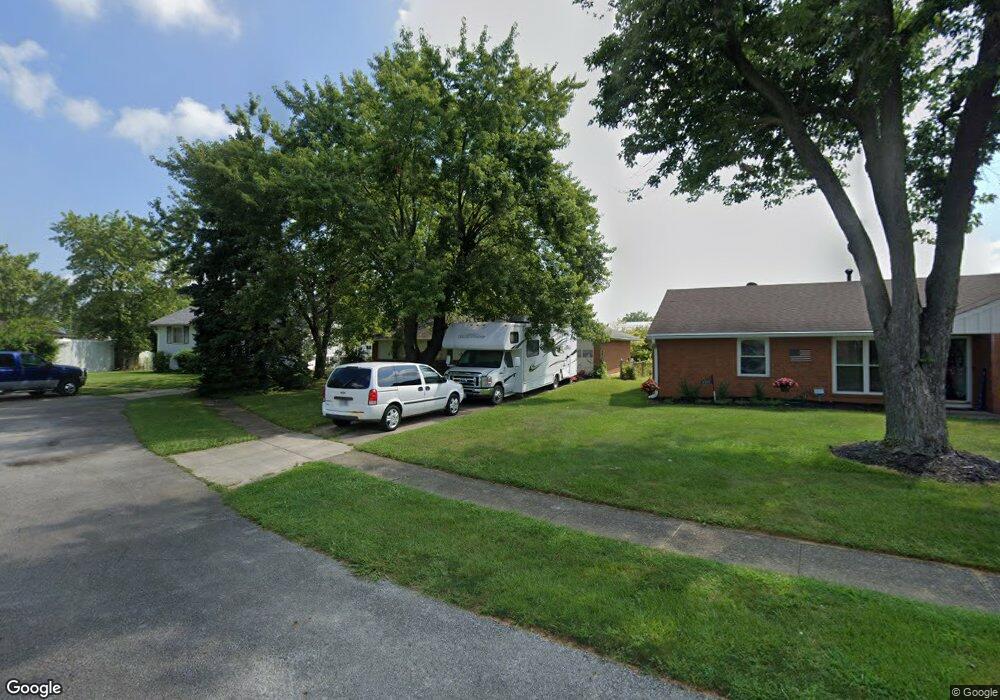
4710 Palmetto St Columbus, OH 43228
Estimated Value: $196,000 - $233,000
4
Beds
2
Baths
1,107
Sq Ft
$190/Sq Ft
Est. Value
About This Home
This home is located at 4710 Palmetto St, Columbus, OH 43228 and is currently estimated at $210,457, approximately $190 per square foot. 4710 Palmetto St is a home located in Franklin County with nearby schools including Stiles Elementary School, Galloway Ridge Intermediate School, and Norton Middle School.
Ownership History
Date
Name
Owned For
Owner Type
Purchase Details
Closed on
Dec 8, 2006
Sold by
Roberts Kathy J and Roberts William M
Bought by
Roberts William M and Roberts Kathy J
Current Estimated Value
Purchase Details
Closed on
Nov 17, 2006
Sold by
Jenkins Jerold C and Estate Of Inez J Jenkins
Bought by
Roberts Kathy J
Purchase Details
Closed on
Sep 9, 2004
Sold by
Jenkins Jerold C and Jenkins Jacque D
Bought by
Jenkins Inez J
Purchase Details
Closed on
Sep 25, 1961
Bought by
Jenkins Charles M
Create a Home Valuation Report for This Property
The Home Valuation Report is an in-depth analysis detailing your home's value as well as a comparison with similar homes in the area
Home Values in the Area
Average Home Value in this Area
Purchase History
| Date | Buyer | Sale Price | Title Company |
|---|---|---|---|
| Roberts William M | -- | Attorney | |
| Roberts Kathy J | $47,000 | Stewart Tit | |
| Jenkins Inez J | -- | -- | |
| Jenkins Charles M | -- | -- |
Source: Public Records
Tax History Compared to Growth
Tax History
| Year | Tax Paid | Tax Assessment Tax Assessment Total Assessment is a certain percentage of the fair market value that is determined by local assessors to be the total taxable value of land and additions on the property. | Land | Improvement |
|---|---|---|---|---|
| 2024 | $2,835 | $62,480 | $16,800 | $45,680 |
| 2023 | $2,702 | $62,475 | $16,800 | $45,675 |
| 2022 | $2,111 | $34,230 | $6,300 | $27,930 |
| 2021 | $2,145 | $34,230 | $6,300 | $27,930 |
| 2020 | $2,135 | $34,230 | $6,300 | $27,930 |
| 2019 | $2,127 | $29,790 | $5,250 | $24,540 |
| 2018 | $1,929 | $29,790 | $5,250 | $24,540 |
| 2017 | $2,008 | $29,790 | $5,250 | $24,540 |
| 2016 | $1,739 | $23,520 | $6,440 | $17,080 |
| 2015 | $1,739 | $23,520 | $6,440 | $17,080 |
| 2014 | $1,719 | $23,520 | $6,440 | $17,080 |
| 2013 | $1,016 | $27,685 | $7,595 | $20,090 |
Source: Public Records
Map
Nearby Homes
- 299 Lombard Rd
- 4637 Hilton Ave
- 264 Woodlawn Ave
- 488 Lombard Rd
- 435 Redmond Rd
- 74 Tarryton Ct E Unit 10A
- 4696 Tarryton Ct S Unit 7-2D
- 4778 Hafey Ave
- 354 Fernhill Ave
- 127 Tarryton Ct W Unit 23D
- 4763 Hafey Ave
- 141 Beacon Run W Unit 26E
- 40 Gladys Rd
- 4715 Sullivant Ave Unit 46
- 218 Darbyhurst Rd
- 5006 Old Tree Ave
- 271 Carilla Ln
- 4789 Dolan Place
- 429 Postle Blvd
- 345 Weymouth Ln
- 4700 Palmetto St
- 4716 Palmetto St
- 4724 Palmetto St
- 4694 Palmetto St
- 4688 Palmetto St
- 4730 Palmetto St
- 4715 Palmetto St
- 4697 Palmetto St
- 4684 Palmetto St
- 4741 Palmetto St
- 4685 Palmetto St
- 4742 Palmetto St
- 4720 Stiles Ave
- 4701 Arnold Ave
- 4685 Arnold Ave
- 4707 Arnold Ave
- 4746 Stiles Ave
- 4677 Arnold Ave
- 4755 Palmetto St
- 4715 Arnold Ave