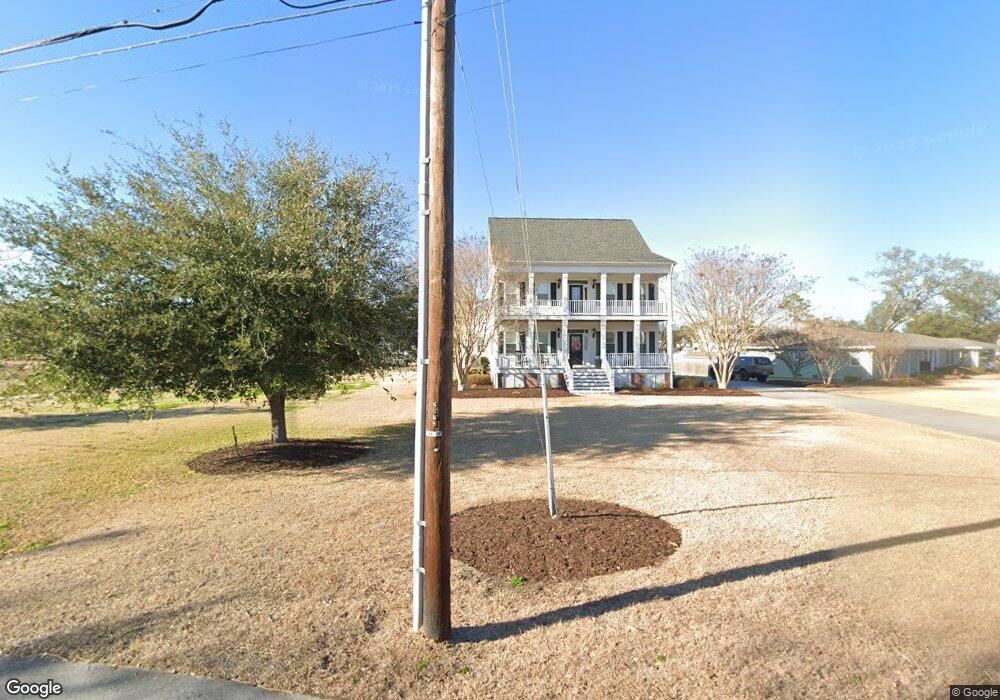
4710 San Juan Cir Morehead City, NC 28557
Estimated Value: $1,194,000 - $1,387,000
3
Beds
4
Baths
3,991
Sq Ft
$325/Sq Ft
Est. Value
About This Home
This home is located at 4710 San Juan Cir, Morehead City, NC 28557 and is currently estimated at $1,296,282, approximately $324 per square foot. 4710 San Juan Cir is a home located in Carteret County with nearby schools including Morehead City Primary School, Morehead Elementary School at Camp Glenn, and Morehead City Middle School.
Ownership History
Date
Name
Owned For
Owner Type
Purchase Details
Closed on
Dec 4, 2008
Sold by
Taft E Hoover and Taft Thomas Fleming
Bought by
Smith Lee Michael and Smith Callie Adkins
Current Estimated Value
Home Financials for this Owner
Home Financials are based on the most recent Mortgage that was taken out on this home.
Original Mortgage
$284,750
Outstanding Balance
$187,041
Interest Rate
6.01%
Mortgage Type
Future Advance Clause Open End Mortgage
Estimated Equity
$1,109,241
Purchase Details
Closed on
Nov 25, 2008
Sold by
Miller Joan L
Bought by
Taft Thomas F and Hoover Taft E
Home Financials for this Owner
Home Financials are based on the most recent Mortgage that was taken out on this home.
Original Mortgage
$284,750
Outstanding Balance
$187,041
Interest Rate
6.01%
Mortgage Type
Future Advance Clause Open End Mortgage
Estimated Equity
$1,109,241
Purchase Details
Closed on
Feb 14, 2006
Sold by
Miller Robert E and Miller Joan L
Bought by
Taft Thomas F and Hoover Taft E
Create a Home Valuation Report for This Property
The Home Valuation Report is an in-depth analysis detailing your home's value as well as a comparison with similar homes in the area
Home Values in the Area
Average Home Value in this Area
Purchase History
| Date | Buyer | Sale Price | Title Company |
|---|---|---|---|
| Smith Lee Michael | $335,000 | None Available | |
| Taft Thomas F | -- | None Available | |
| Taft Thomas F | $606,000 | None Available |
Source: Public Records
Mortgage History
| Date | Status | Borrower | Loan Amount |
|---|---|---|---|
| Open | Smith Lee Michael | $284,750 |
Source: Public Records
Tax History Compared to Growth
Tax History
| Year | Tax Paid | Tax Assessment Tax Assessment Total Assessment is a certain percentage of the fair market value that is determined by local assessors to be the total taxable value of land and additions on the property. | Land | Improvement |
|---|---|---|---|---|
| 2025 | $6,471 | $1,123,032 | $376,215 | $746,817 |
| 2024 | $5,216 | $682,375 | $273,384 | $408,991 |
| 2023 | $2,335 | $682,375 | $273,384 | $408,991 |
| 2022 | $2,267 | $682,375 | $273,384 | $408,991 |
| 2021 | $2,267 | $682,375 | $273,384 | $408,991 |
| 2020 | $2,267 | $682,375 | $273,384 | $408,991 |
| 2019 | $2,081 | $666,453 | $238,685 | $427,768 |
| 2017 | $2,081 | $666,453 | $238,685 | $427,768 |
| 2016 | $2,081 | $666,453 | $238,685 | $427,768 |
| 2015 | $2,014 | $666,453 | $238,685 | $427,768 |
| 2014 | $2,665 | $883,191 | $449,595 | $433,596 |
Source: Public Records
Map
Nearby Homes
- 303 Georgia Ave
- 4737 S Shore Dr
- 4717 S Shore
- 111 Riverside Ave
- 118 Lake Ave Unit 202
- 205 Roanoke Ave
- 113 Lake Ave
- 4425 Arendell St Unit 105 & Slip 38
- 4425 Arendell St Unit Boat Slip 43
- 4425 Arendell St Unit Boat Slip 42
- 4425 Arendell St Unit 609
- 4425 Arendell St Unit 102
- 4425 Arendell St Unit 303 Harborside Club
- 4319 Coral Point Rd
- 218 Rochelle Dr
- 211 Larkin St
- 4513 Country Club Rd Unit G101
- 218 Larkin St
- 202 Savannah Ave
- 204 Savannah Ave
- 4710 San Juan Cir
- 4712 San Juan Cir
- 4708 San Juan Cir
- 2 San Juan Cir
- 4706 San Juan Cir
- 405 Mansfield Pkwy
- 4709 San Juan Cir
- 4704 San Juan Cir
- 309 Mansfield Pkwy
- 304 Georgia Ave
- 304 Georgia Ave
- 405 Mansfield Pkwy
- 405 Mansfield Pkwy Unit H
- 405 Mansfield Pkwy Unit R
- 405 Mansfield Pkwy
- 405 Mansfield Pkwy Unit I
- 405 Mansfield Pkwy Unit J
- 405 Mansfield Pkwy Unit K
- 405 Mansfield Pkwy Unit M
- 405 Mansfield Pkwy