4710 Yoder Ave SW Canton, OH 44706
Estimated Value: $193,000 - $243,000
3
Beds
2
Baths
1,188
Sq Ft
$186/Sq Ft
Est. Value
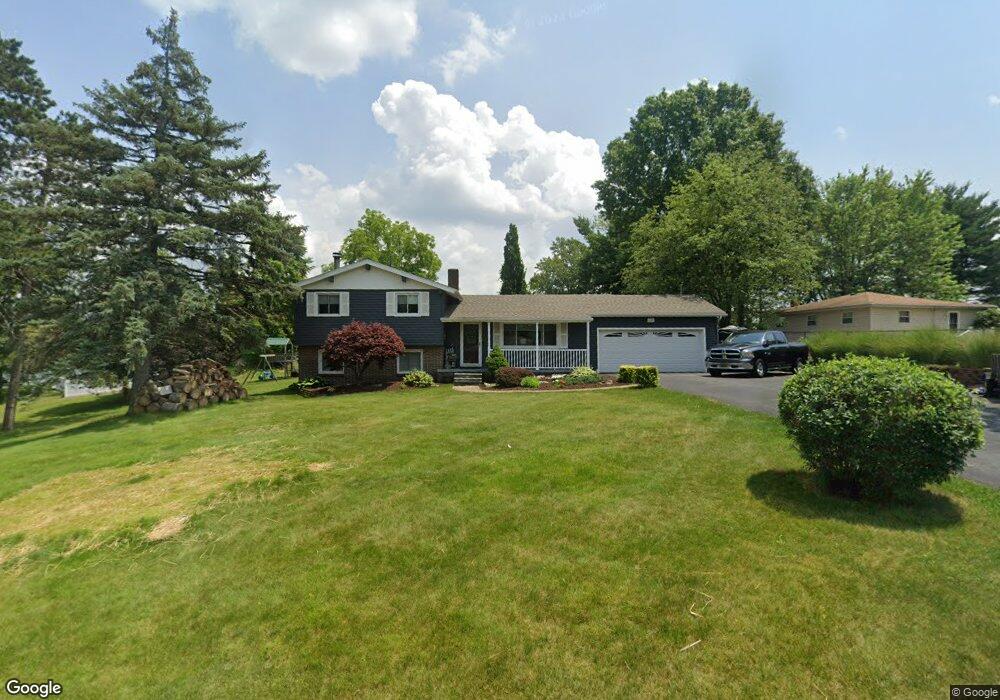
About This Home
This home is located at 4710 Yoder Ave SW, Canton, OH 44706 and is currently estimated at $220,744, approximately $185 per square foot. 4710 Yoder Ave SW is a home located in Stark County with nearby schools including Faircrest Memorial Elementary School, Canton South High School, and Beacon Academy.
Ownership History
Date
Name
Owned For
Owner Type
Purchase Details
Closed on
Jul 2, 1993
Current Estimated Value
Create a Home Valuation Report for This Property
The Home Valuation Report is an in-depth analysis detailing your home's value as well as a comparison with similar homes in the area
Purchase History
| Date | Buyer | Sale Price | Title Company |
|---|---|---|---|
| -- | $68,000 | -- |
Source: Public Records
Tax History
| Year | Tax Paid | Tax Assessment Tax Assessment Total Assessment is a certain percentage of the fair market value that is determined by local assessors to be the total taxable value of land and additions on the property. | Land | Improvement |
|---|---|---|---|---|
| 2025 | -- | $75,960 | $17,680 | $58,280 |
| 2024 | -- | $75,960 | $17,680 | $58,280 |
| 2023 | $2,893 | $62,970 | $11,870 | $51,100 |
| 2022 | $2,630 | $61,850 | $11,870 | $49,980 |
| 2021 | $2,639 | $61,850 | $11,870 | $49,980 |
| 2020 | $2,613 | $53,620 | $10,080 | $43,540 |
| 2019 | $2,654 | $53,620 | $10,080 | $43,540 |
Source: Public Records
Map
Nearby Homes
- 0 49th St SW Unit 5185153
- 0 49th St SW Unit 5185124
- 4847 Ashmont Ave SW
- 5213 Ridge Ave SE
- 0 Birchmont Ave SW Unit 5185117
- 600 53rd St SW
- 5247 Birchmont Ave SW
- 327 39th St SW
- 3673 Highview Ave SW
- 330 34th St SW
- 337 33rd St SW
- 260 Ironwood St SW
- 1005 Overlook Dr SW
- 0 Rexdale St SW
- VL 38th St SW
- 2749 Deer Pass Dr SW
- 2103 Henry Ave SW
- 2511 Sherr Ave SE
- 1721 Hammond Ave SW
- 0 20th St SW
- 4724 Yoder Ave SW
- 4629 Yoder Ave SW
- 4635 Yoder Ave SW
- 4721 Hillport Dr SW
- 4703 Hillport Dr SW
- 4711 Yoder Ave SW
- 265 48th St SW
- 211 48th St SW
- 0 Hillport Ave SW
- 4627 Yoder Ave SW
- 222 48th St SW
- 4741 Hillport Dr SW
- 273 48th St SW
- 4634 Hillport Dr SW
- 244 48th St SW
- 4626 Hillport Dr SW
- 4612 Yoder Ave SW
- 4609 Yoder Ave SW
- 222 46th St SW
- 303 48th St SW
Your Personal Tour Guide
Ask me questions while you tour the home.