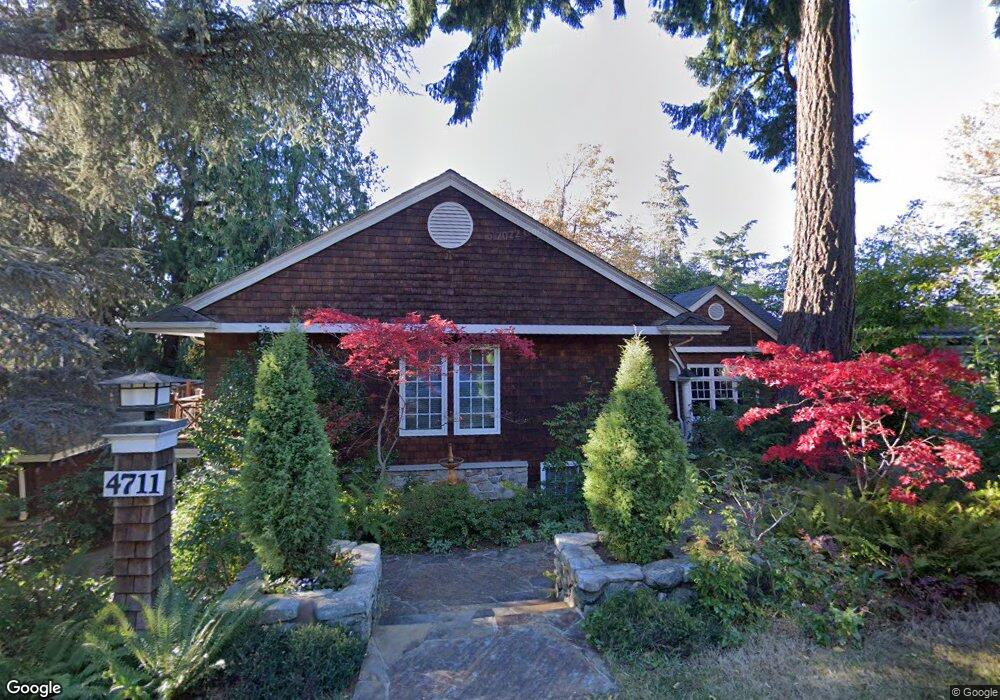
4711 84th Ave SE Mercer Island, WA 98040
Forest Avenue NeighborhoodEstimated Value: $1,955,000 - $3,007,000
4
Beds
5
Baths
2,260
Sq Ft
$1,186/Sq Ft
Est. Value
About This Home
This home is located at 4711 84th Ave SE, Mercer Island, WA 98040 and is currently estimated at $2,679,758, approximately $1,185 per square foot. 4711 84th Ave SE is a home located in King County with nearby schools including Island Park Elementary School, Islander Middle School, and Mercer Island High School.
Ownership History
Date
Name
Owned For
Owner Type
Purchase Details
Closed on
Apr 25, 2016
Sold by
Smith Arnold L and Smith Peterson Cheyne
Bought by
Smith Family Trust
Current Estimated Value
Purchase Details
Closed on
Aug 2, 2005
Sold by
Smith Arnold L and Smith Peterson Cheyne
Bought by
Smith Arnold L and Smith Peterson Cheyne
Purchase Details
Closed on
Apr 18, 2003
Sold by
Fletcher Jonathan M and Fletcher Katie G
Bought by
Smith Arnold L and Smith Peterson Cheyne
Purchase Details
Closed on
May 9, 2002
Sold by
Fletcher Jonathan M and Fletcher Katie G
Bought by
Fletcher Jonathan M and Fletcher Katie G
Purchase Details
Closed on
Apr 4, 1997
Sold by
Lounsbury J C and Lounsbury Lavina
Bought by
Fletcher Jonathan M and Fletcher Katie G
Home Financials for this Owner
Home Financials are based on the most recent Mortgage that was taken out on this home.
Original Mortgage
$380,000
Interest Rate
5.37%
Create a Home Valuation Report for This Property
The Home Valuation Report is an in-depth analysis detailing your home's value as well as a comparison with similar homes in the area
Home Values in the Area
Average Home Value in this Area
Purchase History
| Date | Buyer | Sale Price | Title Company |
|---|---|---|---|
| Smith Family Trust | -- | None Available | |
| Smith Arnold L | -- | -- | |
| Smith Arnold L | $1,495,000 | Chicago Title | |
| Fletcher Jonathan M | -- | -- | |
| Fletcher Jonathan M | $475,000 | Transnation Title Insurance |
Source: Public Records
Mortgage History
| Date | Status | Borrower | Loan Amount |
|---|---|---|---|
| Previous Owner | Fletcher Jonathan M | $380,000 |
Source: Public Records
Tax History Compared to Growth
Tax History
| Year | Tax Paid | Tax Assessment Tax Assessment Total Assessment is a certain percentage of the fair market value that is determined by local assessors to be the total taxable value of land and additions on the property. | Land | Improvement |
|---|---|---|---|---|
| 2024 | $13,918 | $2,124,000 | $1,263,000 | $861,000 |
| 2023 | $14,006 | $2,033,000 | $1,192,000 | $841,000 |
| 2022 | $12,211 | $2,274,000 | $1,341,000 | $933,000 |
| 2021 | $12,159 | $1,657,000 | $1,104,000 | $553,000 |
| 2020 | $11,620 | $1,518,000 | $1,052,000 | $466,000 |
| 2018 | $11,562 | $1,476,000 | $898,000 | $578,000 |
| 2017 | $11,400 | $1,332,000 | $812,000 | $520,000 |
| 2016 | $10,604 | $1,199,000 | $743,000 | $456,000 |
| 2015 | $10,222 | $1,268,000 | $889,000 | $379,000 |
| 2014 | -- | $1,168,000 | $822,000 | $346,000 |
| 2013 | -- | $1,154,000 | $745,000 | $409,000 |
Source: Public Records
Map
Nearby Homes
- 4825 88th Ave SE
- 4332 W Mercer Way
- 4817 91st Ave SE
- 8150 Evergreen Ln
- 4230 W Mercer Way
- 9458 SE 47th St
- 18 Holly Ln
- 5019 E Mercer Way
- 0 XX23 91st Ave SE
- 0 XXX 91st Ave SE
- 9433 SE 54th St
- 4150 Boulevard Place
- 4802 E Mercer Way
- 44 xx Ferncroft Rd
- 4025 86th Ave SE
- 5044 Butterworth Rd
- 8456 SE 40th St
- 3706 84th Ave SE
- 7929 SE 37th St
- 4222 Shoreclub Dr
- 4701 84th Ave SE
- 4701 1/2 84th Ave SE
- 4731 84th Ave SE
- 4701 W Mercer Way
- 38 xx W Mercer Way
- 81 xx W Mercer Way
- 4720 84th Ave SE
- 4681 W Mercer Way
- 4725 W Mercer Way
- 4664 84th Ave SE
- 8405 SE 47th Place
- 4740 W Mercer Way
- 4661 W Mercer Way
- 8410 SE 47th St
- 8411 SE 47th Place
- 4735 W Mercer Way
- 4710 81st Ave SE
- 4680 81st Ave SE
- 4714 81st Ave SE
- 8412 SE 47th St