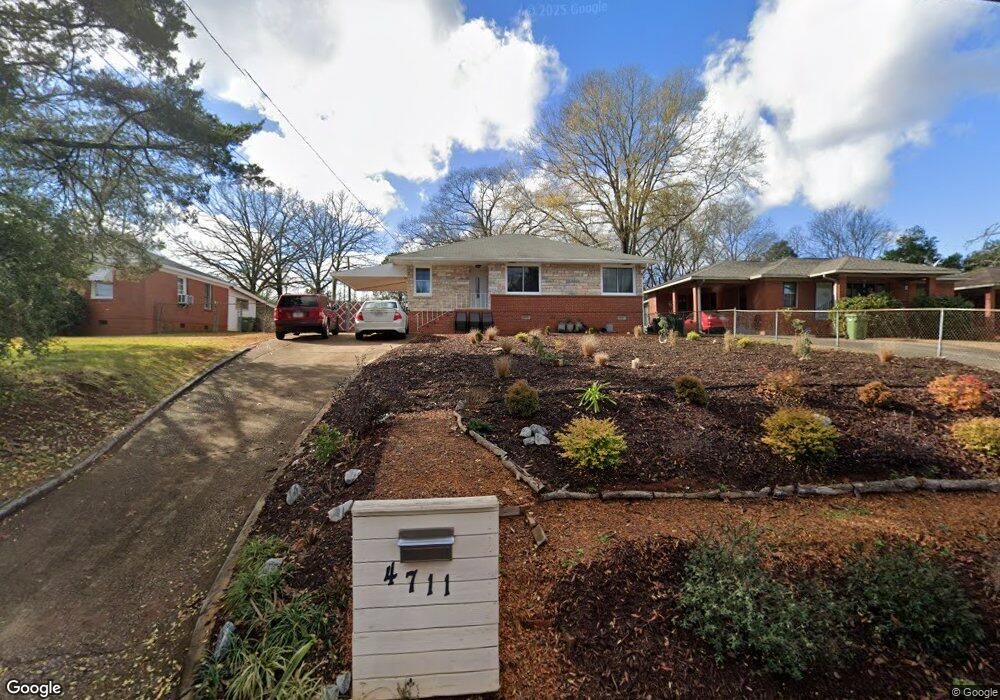
4711 Drew Ave Columbus, GA 31904
Northern Columbus NeighborhoodEstimated Value: $110,000 - $152,000
3
Beds
2
Baths
1,245
Sq Ft
$107/Sq Ft
Est. Value
About This Home
This home is located at 4711 Drew Ave, Columbus, GA 31904 and is currently estimated at $132,844, approximately $106 per square foot. 4711 Drew Ave is a home located in Muscogee County with nearby schools including River Road Elementary School, Double Churches Middle School, and Jordan Vocational High School.
Ownership History
Date
Name
Owned For
Owner Type
Purchase Details
Closed on
Nov 14, 2017
Sold by
Ucm Holdings Llc
Bought by
Wilson Lonnie and Franklin Diana
Current Estimated Value
Home Financials for this Owner
Home Financials are based on the most recent Mortgage that was taken out on this home.
Original Mortgage
$87,387
Outstanding Balance
$74,264
Interest Rate
4.4%
Mortgage Type
FHA
Estimated Equity
$58,580
Purchase Details
Closed on
Jun 20, 2017
Sold by
Nationstar Mtg Llc
Bought by
Ucm Holdings Llc
Purchase Details
Closed on
May 2, 2017
Sold by
Davis Jason T
Bought by
Nationstar Mtg Llc
Purchase Details
Closed on
Nov 25, 2009
Sold by
Mcdaniel Zackery A and Mcdaniel Edward
Bought by
Davis Jason T
Home Financials for this Owner
Home Financials are based on the most recent Mortgage that was taken out on this home.
Original Mortgage
$94,162
Interest Rate
4.98%
Mortgage Type
FHA
Create a Home Valuation Report for This Property
The Home Valuation Report is an in-depth analysis detailing your home's value as well as a comparison with similar homes in the area
Home Values in the Area
Average Home Value in this Area
Purchase History
| Date | Buyer | Sale Price | Title Company |
|---|---|---|---|
| Wilson Lonnie | $89,000 | -- | |
| Ucm Holdings Llc | $35,420 | -- | |
| Nationstar Mtg Llc | $35,420 | -- | |
| Davis Jason T | $95,900 | None Available |
Source: Public Records
Mortgage History
| Date | Status | Borrower | Loan Amount |
|---|---|---|---|
| Open | Wilson Lonnie | $87,387 | |
| Previous Owner | Davis Jason T | $94,162 |
Source: Public Records
Tax History Compared to Growth
Tax History
| Year | Tax Paid | Tax Assessment Tax Assessment Total Assessment is a certain percentage of the fair market value that is determined by local assessors to be the total taxable value of land and additions on the property. | Land | Improvement |
|---|---|---|---|---|
| 2025 | $738 | $44,160 | $9,372 | $34,788 |
| 2024 | $737 | $44,160 | $9,372 | $34,788 |
| 2023 | $768 | $44,160 | $9,372 | $34,788 |
| 2022 | $768 | $35,720 | $7,028 | $28,692 |
| 2021 | $762 | $32,044 | $7,028 | $25,016 |
| 2020 | $762 | $32,044 | $7,028 | $25,016 |
| 2019 | $1,313 | $32,044 | $7,028 | $25,016 |
| 2018 | $1,313 | $32,044 | $7,028 | $25,016 |
| 2017 | $1,317 | $32,044 | $7,028 | $25,016 |
| 2016 | $1,581 | $38,315 | $2,640 | $35,675 |
| 2015 | $1,582 | $38,315 | $2,640 | $35,675 |
| 2014 | $1,584 | $38,315 | $2,640 | $35,675 |
| 2013 | -- | $38,315 | $2,640 | $35,675 |
Source: Public Records
Map
Nearby Homes