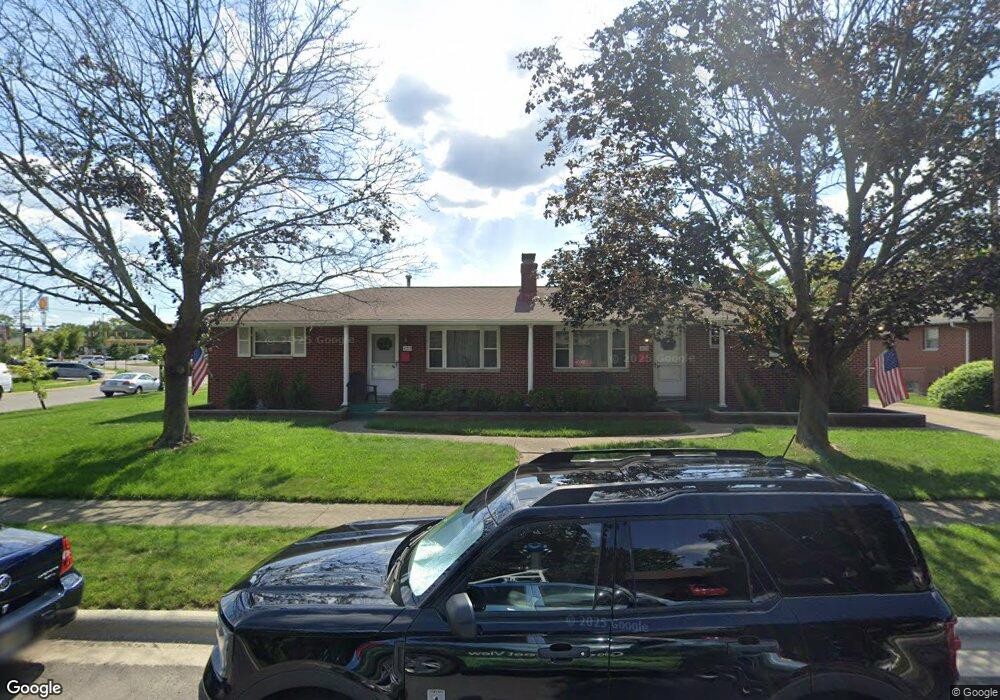
4711 Esterbrook Rd Unit 713 Columbus, OH 43229
Woodward Park NeighborhoodEstimated Value: $312,000 - $337,000
4
Beds
2
Baths
1,836
Sq Ft
$177/Sq Ft
Est. Value
About This Home
This home is located at 4711 Esterbrook Rd Unit 713, Columbus, OH 43229 and is currently estimated at $325,437, approximately $177 per square foot. 4711 Esterbrook Rd Unit 713 is a home located in Franklin County with nearby schools including Valley Forge Elementary School, Woodward Park Middle School, and Northland High School.
Ownership History
Date
Name
Owned For
Owner Type
Purchase Details
Closed on
Sep 14, 2023
Sold by
Dino F Fancelli Trust
Bought by
Taylor Steven A
Current Estimated Value
Purchase Details
Closed on
Jun 27, 2018
Sold by
Fancelli Dino F
Bought by
Fancelli Dino F and Dino F Fancelli Trust
Purchase Details
Closed on
Dec 9, 2013
Sold by
Fancelli Emma M
Bought by
Fancelli Emma M and The Trust Agreement Of Emma M Fancelli
Purchase Details
Closed on
Jun 16, 2008
Sold by
Fancelli Emma M
Bought by
Fancelli Emma M
Purchase Details
Closed on
Jul 3, 2001
Sold by
Fancelli Emma M
Bought by
Fancelli Emma M and Emma M Fancelli Living Trust
Purchase Details
Closed on
Dec 19, 1980
Bought by
Fancelli Emma M
Create a Home Valuation Report for This Property
The Home Valuation Report is an in-depth analysis detailing your home's value as well as a comparison with similar homes in the area
Home Values in the Area
Average Home Value in this Area
Purchase History
| Date | Buyer | Sale Price | Title Company |
|---|---|---|---|
| Taylor Steven A | -- | None Listed On Document | |
| Fancelli Dino F | -- | None Available | |
| Fancelli Dino F | -- | None Available | |
| Fancelli Emma M | -- | None Available | |
| Fancelli Emma M | -- | None Available | |
| Fancelli Emma M | -- | Peterson Title Agency | |
| Fancelli Emma M | -- | -- |
Source: Public Records
Tax History Compared to Growth
Tax History
| Year | Tax Paid | Tax Assessment Tax Assessment Total Assessment is a certain percentage of the fair market value that is determined by local assessors to be the total taxable value of land and additions on the property. | Land | Improvement |
|---|---|---|---|---|
| 2024 | $7,543 | $88,730 | $20,300 | $68,430 |
| 2023 | $3,973 | $88,730 | $20,300 | $68,430 |
| 2022 | $2,522 | $48,030 | $10,960 | $37,070 |
| 2021 | $2,526 | $48,030 | $10,960 | $37,070 |
| 2020 | $2,528 | $47,990 | $10,960 | $37,030 |
| 2019 | $2,356 | $38,360 | $8,750 | $29,610 |
| 2018 | $2,221 | $38,360 | $8,750 | $29,610 |
| 2017 | $1,825 | $38,360 | $8,750 | $29,610 |
| 2016 | $2,299 | $42,910 | $9,730 | $33,180 |
| 2015 | $2,091 | $42,910 | $9,730 | $33,180 |
| 2014 | $2,096 | $42,910 | $9,730 | $33,180 |
| 2013 | $1,160 | $47,075 | $10,220 | $36,855 |
Source: Public Records
Map
Nearby Homes
- 1116 Tulsa Dr
- 1125 Upland Dr
- 1266 Pershing Dr
- 1071 Loring Rd
- 4904 Almont Dr
- 4983 Almont Dr
- 4441 Wetmore Rd E
- 4791 Bourke Rd
- 1414 Alvina Dr
- 4815 Bourke Rd
- 4800 Bourke Rd
- 4761 Colonel Perry Dr
- 4816 Bourke Rd
- 4455 Kenfield Rd
- 4852 Colonel Perry Dr
- 1191 Bryson Rd
- 1385 Thurell Rd
- 1485 Norma Rd
- 4923 Karl Rd Unit 4925
- 1130 Carbone Dr
- 4695 Maize Rd Unit 697
- 4695 Maize Rd Unit A & B
- 4697 Maize Rd Unit A&B
- 4719 Esterbrook Rd
- 4718-4720 Esterbrook Rd
- 4718 Esterbrook Rd Unit 720
- 4697 Dechant Rd Unit A & B
- 4731 Esterbrook Rd
- 4710 Dechant Rd Unit 712
- 4710 Dechant Rd Unit 4710 Dechant Rd
- 4710 Dechant Rd
- 4728 Esterbrook Rd
- 4722-4724 Dechant Rd
- 4722 Dechant Rd Unit 724
- 4711 Maize Rd Unit 713
- 4739 Esterbrook Rd
- 4736 Esterbrook Rd
- 4724 Dechant Rd
- 4734 Dechant Rd Unit 736
- 1234 Morse Rd