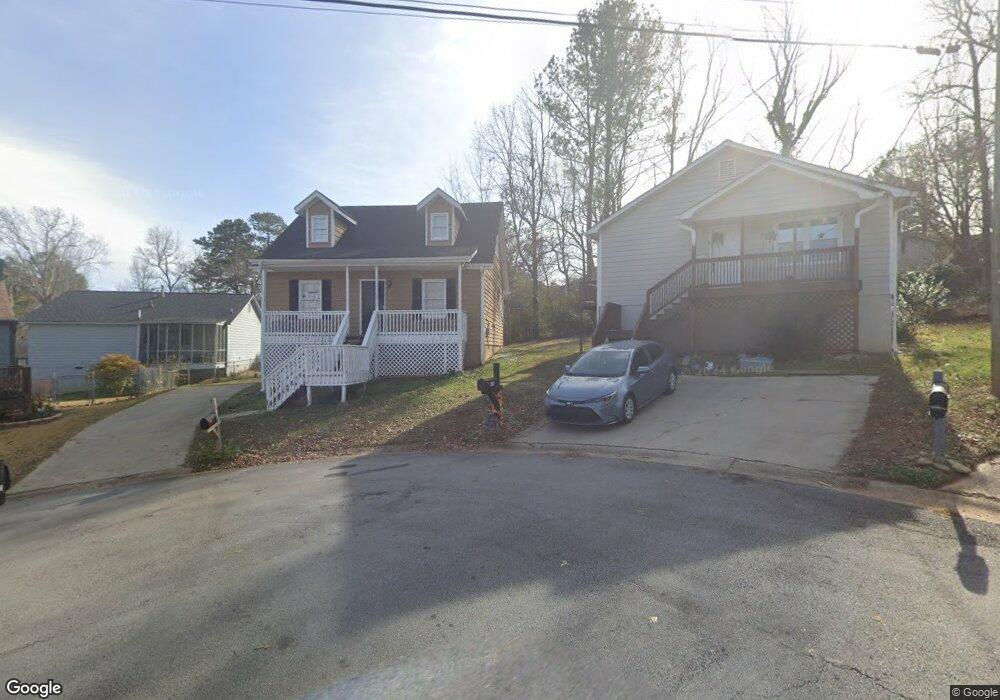
4711 Pebble Ct Buford, GA 30518
Estimated Value: $264,000 - $310,000
3
Beds
2
Baths
1,294
Sq Ft
$226/Sq Ft
Est. Value
About This Home
This home is located at 4711 Pebble Ct, Buford, GA 30518 and is currently estimated at $292,106, approximately $225 per square foot. 4711 Pebble Ct is a home located in Gwinnett County with nearby schools including Buford Elementary School, Buford Senior Academy, and Buford Academy.
Ownership History
Date
Name
Owned For
Owner Type
Purchase Details
Closed on
Aug 6, 2018
Sold by
Resi Sfr Sub Llc
Bought by
Fyr Sfr Borrower Llc
Current Estimated Value
Purchase Details
Closed on
Jul 26, 2016
Sold by
Wanda K
Bought by
Resi Sfr Sub Llc and O Altisource Asse C
Purchase Details
Closed on
May 3, 2001
Sold by
No Worries Inc Invst
Bought by
Burel Wanda K
Home Financials for this Owner
Home Financials are based on the most recent Mortgage that was taken out on this home.
Original Mortgage
$52,500
Interest Rate
6.95%
Purchase Details
Closed on
Feb 27, 2001
Sold by
Thornton Ronetta W
Bought by
No Worries Inc Investments
Purchase Details
Closed on
Feb 28, 2000
Sold by
Thornton Fredrick and Thornton Ronetta
Bought by
Thornton Ronetta
Purchase Details
Closed on
Jan 6, 1998
Sold by
Macks Daniel A and Macks Christy K
Bought by
Chase Manhattan M C
Purchase Details
Closed on
Oct 30, 1996
Sold by
Triangle Prop Inc
Bought by
Macks Daniel A Christy K
Create a Home Valuation Report for This Property
The Home Valuation Report is an in-depth analysis detailing your home's value as well as a comparison with similar homes in the area
Home Values in the Area
Average Home Value in this Area
Purchase History
| Date | Buyer | Sale Price | Title Company |
|---|---|---|---|
| Fyr Sfr Borrower Llc | $5,410,100 | -- | |
| Resi Sfr Sub Llc | $84,000 | -- | |
| Burel Wanda K | $70,000 | -- | |
| No Worries Inc Investments | $68,700 | -- | |
| Thornton Ronetta | -- | -- | |
| Chase Manhattan M C | $68,374 | -- | |
| Macks Daniel A Christy K | $65,500 | -- |
Source: Public Records
Mortgage History
| Date | Status | Borrower | Loan Amount |
|---|---|---|---|
| Previous Owner | Burel Wanda K | $52,500 | |
| Previous Owner | Burel Wanda K | $10,500 | |
| Closed | Macks Daniel A Christy K | $0 |
Source: Public Records
Tax History
| Year | Tax Paid | Tax Assessment Tax Assessment Total Assessment is a certain percentage of the fair market value that is determined by local assessors to be the total taxable value of land and additions on the property. | Land | Improvement |
|---|---|---|---|---|
| 2025 | $1,339 | $109,760 | $26,800 | $82,960 |
| 2024 | $1,417 | $98,720 | $19,600 | $79,120 |
| 2023 | $1,417 | $98,720 | $19,600 | $79,120 |
| 2022 | $1,114 | $77,640 | $16,000 | $61,640 |
| 2021 | $688 | $47,960 | $8,000 | $39,960 |
| 2020 | $688 | $47,960 | $8,000 | $39,960 |
| 2019 | $517 | $39,920 | $8,000 | $31,920 |
| 2018 | $517 | $39,920 | $8,000 | $31,920 |
| 2016 | $329 | $25,640 | $4,000 | $21,640 |
| 2015 | $305 | $22,960 | $4,000 | $18,960 |
| 2014 | $213 | $15,800 | $3,000 | $12,800 |
Source: Public Records
Map
Nearby Homes
- 3016 Pebblebrook Dr
- 3020 Pebblebrook Dr
- 2938 Pebblebrook Dr
- 2710 Blake Towers Ln
- 2307 Loughridge Dr
- Lot 2 Thunder Rd
- Lot 3 Thunder Rd
- 406 Thunder Rd
- 2838 N Bogan Rd
- 3372 Wild Clary (Lot 69) Ct
- 405 Thunder Rd
- 1049 Caruso Dr
- 1098 Caruso Dr
- 3263 N Bogan Rd NE
- 575 Forest St
- 3267 N Bogan Rd NE
- 4679 Silver Meadow Dr
- 3271 Meadow Lily Ct
- 2802 Lakeview Ct
- 570 Power Ave
- 4711 Pebble Ct
- 4682 Vintage Ct
- 4715 Pebble Ct
- 4686 Vintage Ct Unit 3
- 4707 Pebble Ct
- 4716 Pebble Ct
- 4678 Vintage Ct
- 4690 Vintage Ct
- 4757 Pebble Trace
- 4761 Pebble Trace
- 4753 Pebble Trace
- 4720 Pebble Ct Unit 3
- 4703 Pebble Ct Unit 3
- 4765 Pebble Trace
- 4694 Vintage Ct Unit 3
- 4728 Arden Dr
- 4749 Pebble Trace Unit 3
- 4744 Arden Dr
- 4677 Vintage Ct
- 4669 Vintage Ct
Your Personal Tour Guide
Ask me questions while you tour the home.