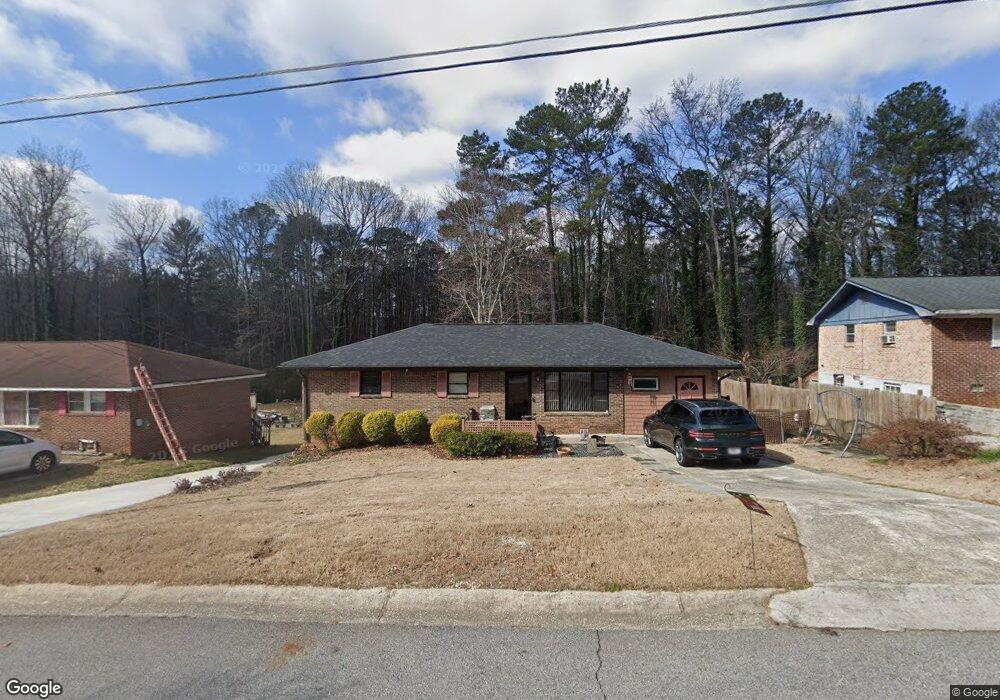
4711 Ryan Rd Conley, GA 30288
Estimated Value: $145,000 - $186,000
3
Beds
1
Bath
1,040
Sq Ft
$156/Sq Ft
Est. Value
About This Home
This home is located at 4711 Ryan Rd, Conley, GA 30288 and is currently estimated at $162,060, approximately $155 per square foot. 4711 Ryan Rd is a home located in Clayton County with nearby schools including Forest Park Middle School, Forest Park High School, and Utopian Academy for the Arts Elementary School.
Ownership History
Date
Name
Owned For
Owner Type
Purchase Details
Closed on
Jun 20, 2019
Sold by
Slaton Joel
Bought by
Mondragon Raul
Current Estimated Value
Purchase Details
Closed on
Jul 16, 1996
Sold by
Atl Lending Grp
Bought by
Slanton Joel
Purchase Details
Closed on
Jan 2, 1996
Sold by
Nelly Stanley Marissa
Bought by
Atlanta Lending Group
Purchase Details
Closed on
Mar 30, 1994
Sold by
Atlanta Lending Group 1988 Ltd
Bought by
Neely Stanley Marissa
Home Financials for this Owner
Home Financials are based on the most recent Mortgage that was taken out on this home.
Original Mortgage
$58,000
Interest Rate
7.61%
Mortgage Type
Seller Take Back
Create a Home Valuation Report for This Property
The Home Valuation Report is an in-depth analysis detailing your home's value as well as a comparison with similar homes in the area
Home Values in the Area
Average Home Value in this Area
Purchase History
| Date | Buyer | Sale Price | Title Company |
|---|---|---|---|
| Mondragon Raul | $42,000 | -- | |
| Slanton Joel | $66,000 | -- | |
| Atlanta Lending Group | $61,500 | -- | |
| Neely Stanley Marissa | $58,000 | -- |
Source: Public Records
Mortgage History
| Date | Status | Borrower | Loan Amount |
|---|---|---|---|
| Previous Owner | Neely Stanley Marissa | $58,000 |
Source: Public Records
Tax History Compared to Growth
Tax History
| Year | Tax Paid | Tax Assessment Tax Assessment Total Assessment is a certain percentage of the fair market value that is determined by local assessors to be the total taxable value of land and additions on the property. | Land | Improvement |
|---|---|---|---|---|
| 2024 | $627 | $40,520 | $5,600 | $34,920 |
| 2023 | $1,486 | $41,160 | $5,600 | $35,560 |
| 2022 | $781 | $29,000 | $5,600 | $23,400 |
| 2021 | $735 | $27,720 | $5,600 | $22,120 |
| 2020 | $707 | $16,800 | $5,600 | $11,200 |
| 2019 | $753 | $27,684 | $5,600 | $22,084 |
| 2018 | $757 | $27,778 | $5,600 | $22,178 |
| 2017 | $701 | $26,379 | $5,600 | $20,779 |
| 2016 | $715 | $26,709 | $5,600 | $21,109 |
| 2015 | $717 | $0 | $0 | $0 |
| 2014 | $691 | $26,470 | $5,600 | $20,870 |
Source: Public Records
Map
Nearby Homes
- 4540 Karla Cir
- 4834 Bartlett Rd
- 1350 Lori Ct
- 4479 Richard Rd
- 1506 Ravenel Rd Unit 3
- 1660 Mallard Cir
- 1556 Rock Cut Rd
- 4390 Rock Valley Dr
- 4368 Rocky View Dr
- 1132 Grace Dr Unit 3
- 4346 Edinburgh Way Unit 1
- 1126 Grace Dr
- 1101 Lloyd Dr
- 1083 Grace Dr
- 1521 Valley Green Ct
- 1639 Burks Dr
- 1822 Slate Rd
- 1711 Rock Cut Rd
- 1671 Lamont Ave
- 1048 Ferguson Ct