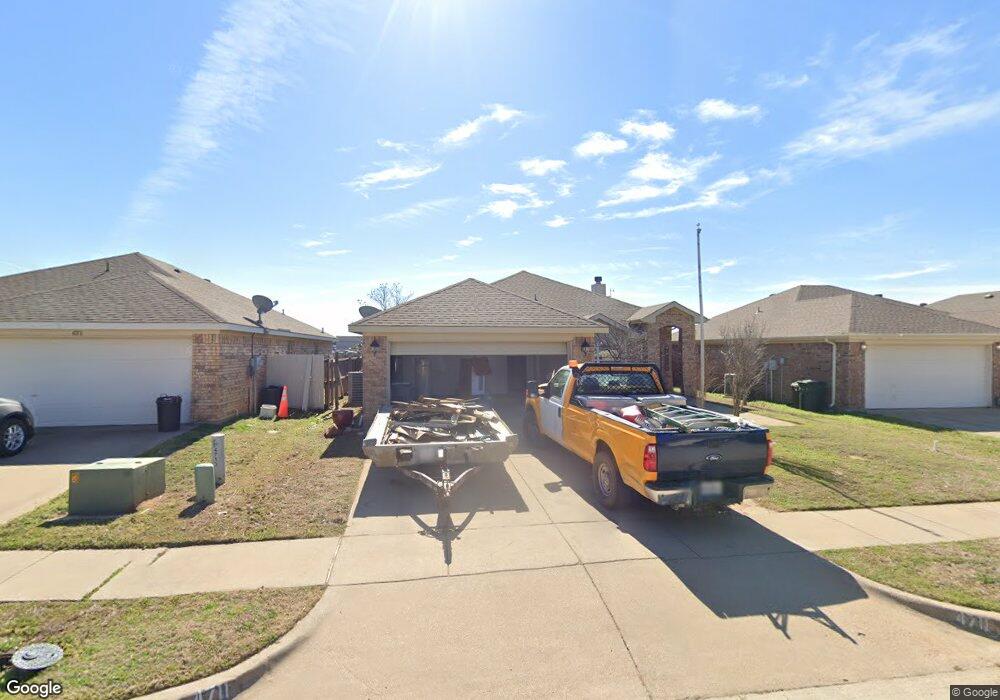
4711 Topaz Ln Granbury, TX 76049
Estimated Value: $238,493 - $287,000
--
Bed
--
Bath
1,736
Sq Ft
$158/Sq Ft
Est. Value
About This Home
This home is located at 4711 Topaz Ln, Granbury, TX 76049 and is currently estimated at $273,873, approximately $157 per square foot. 4711 Topaz Ln is a home located in Hood County with nearby schools including Oak Woods School, Acton Middle School, and Granbury High School.
Ownership History
Date
Name
Owned For
Owner Type
Purchase Details
Closed on
Sep 28, 2023
Sold by
Reiner James Arthur
Bought by
Merrithew and Merrithew M
Current Estimated Value
Purchase Details
Closed on
May 9, 2023
Sold by
Reiner James A
Bought by
Reiner James A
Purchase Details
Closed on
Aug 11, 2006
Sold by
Choice Homes Inc
Bought by
Reiner James A and Reiner Barbara
Home Financials for this Owner
Home Financials are based on the most recent Mortgage that was taken out on this home.
Original Mortgage
$117,000
Interest Rate
9.6%
Mortgage Type
Adjustable Rate Mortgage/ARM
Purchase Details
Closed on
May 9, 2006
Sold by
Jasper Development Ltd
Bought by
Choice Homes Inc
Purchase Details
Closed on
Nov 2, 2001
Sold by
Granbury Medical Properties
Bought by
Reiner James A
Create a Home Valuation Report for This Property
The Home Valuation Report is an in-depth analysis detailing your home's value as well as a comparison with similar homes in the area
Home Values in the Area
Average Home Value in this Area
Purchase History
| Date | Buyer | Sale Price | Title Company |
|---|---|---|---|
| Merrithew | -- | Capital Title | |
| Reiner James A | -- | None Listed On Document | |
| Reiner James A | -- | Central Texas Title | |
| Choice Homes Inc | -- | Central Texas Title | |
| Reiner James A | -- | -- |
Source: Public Records
Mortgage History
| Date | Status | Borrower | Loan Amount |
|---|---|---|---|
| Previous Owner | Reiner James A | $117,000 |
Source: Public Records
Tax History Compared to Growth
Tax History
| Year | Tax Paid | Tax Assessment Tax Assessment Total Assessment is a certain percentage of the fair market value that is determined by local assessors to be the total taxable value of land and additions on the property. | Land | Improvement |
|---|---|---|---|---|
| 2025 | $3,802 | $287,630 | $30,000 | $257,630 |
| 2024 | $3,204 | $200,000 | $30,000 | $170,000 |
| 2023 | $4,691 | $292,870 | $30,000 | $262,870 |
| 2022 | $4,380 | $256,040 | $25,000 | $231,040 |
| 2021 | $3,907 | $202,300 | $25,000 | $177,300 |
| 2020 | $3,732 | $191,140 | $25,000 | $166,140 |
| 2019 | $3,718 | $183,580 | $25,000 | $158,580 |
| 2018 | $3,340 | $164,930 | $25,000 | $139,930 |
| 2017 | $3,087 | $149,150 | $20,000 | $129,150 |
| 2016 | $2,960 | $143,000 | $20,000 | $123,000 |
| 2015 | $2,791 | $139,450 | $20,000 | $119,450 |
| 2014 | $2,791 | $135,860 | $20,000 | $115,860 |
Source: Public Records
Map
Nearby Homes
- 4726 Topaz Ln
- 4712 Topaz Ln
- 4203 Jasper Ln
- 4816 Topaz Ln
- 4823 Topaz Ln
- 229 Jacinth Ln
- 712 Rolling Terrace Cir
- 422 Woodcreek Ct
- 428 Penny Ct
- 2401 True Grit Way
- 109 Seabiscuit Ct
- 101 Seabiscuit Ct
- 105 Seabiscuit Ct
- 4400 Kristy Ct
- 5284 E Us Highway 377
- 204 Affirmed Ct
- 4406 Bobbie Ann Dr
- 4404 Bobbie Ann Dr
- 205 Affirmed Ct
- 209 Affirmed Ct