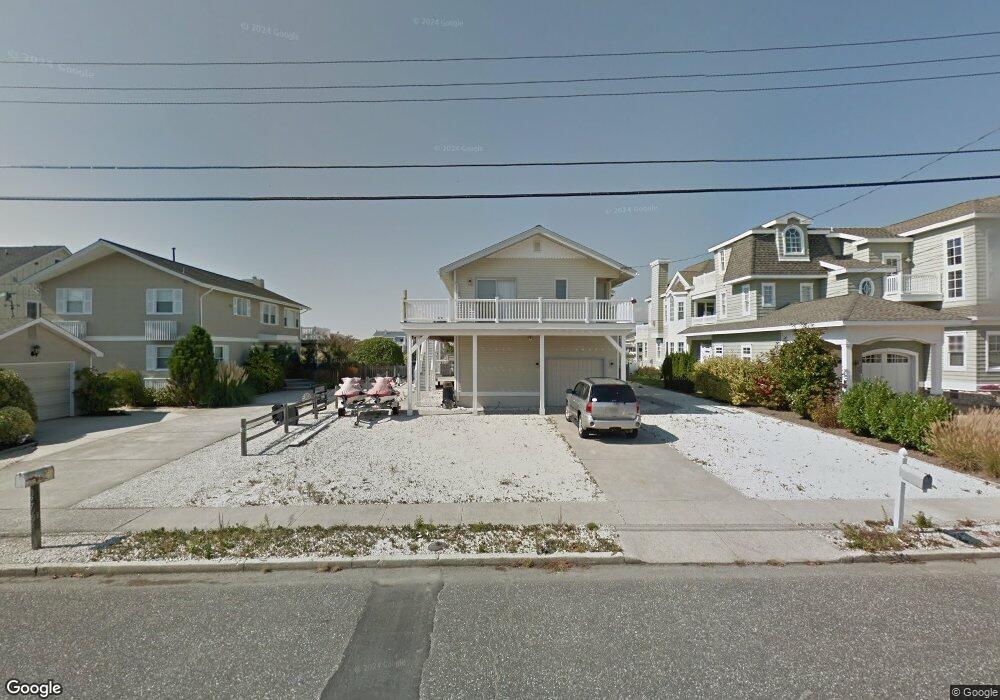
4712 4th Ave Avalon, NJ 08202
Estimated Value: $4,239,000 - $5,670,276
--
Bed
--
Bath
2,526
Sq Ft
$2,008/Sq Ft
Est. Value
About This Home
This home is located at 4712 4th Ave, Avalon, NJ 08202 and is currently estimated at $5,072,425, approximately $2,008 per square foot. 4712 4th Ave is a home located in Cape May County with nearby schools including Avalon Elementary School.
Ownership History
Date
Name
Owned For
Owner Type
Purchase Details
Closed on
Dec 14, 2012
Sold by
Rieders Michael F
Bought by
Rieders Michael F and Rieders Marian D
Current Estimated Value
Purchase Details
Closed on
Mar 31, 1992
Sold by
Mccarron Mccarron J and Mccarron Claudia D
Bought by
Rieders Michael F and Rieders Marian D
Purchase Details
Closed on
Jan 13, 1989
Sold by
Burns William and Burns Sarah
Bought by
Mccarron Mccarron J and Mccarron Claudia
Create a Home Valuation Report for This Property
The Home Valuation Report is an in-depth analysis detailing your home's value as well as a comparison with similar homes in the area
Home Values in the Area
Average Home Value in this Area
Purchase History
| Date | Buyer | Sale Price | Title Company |
|---|---|---|---|
| Rieders Michael F | -- | None Available | |
| Rieders Michael F | -- | None Available | |
| Rieders Michael F | $495,000 | -- | |
| Mccarron Mccarron J | $530,000 | -- |
Source: Public Records
Tax History Compared to Growth
Tax History
| Year | Tax Paid | Tax Assessment Tax Assessment Total Assessment is a certain percentage of the fair market value that is determined by local assessors to be the total taxable value of land and additions on the property. | Land | Improvement |
|---|---|---|---|---|
| 2025 | $11,753 | $1,914,200 | $1,700,000 | $214,200 |
| 2024 | $11,753 | $1,914,200 | $1,700,000 | $214,200 |
| 2023 | $11,657 | $1,914,200 | $1,700,000 | $214,200 |
| 2022 | $10,471 | $1,914,200 | $1,700,000 | $214,200 |
| 2021 | $10,471 | $1,914,200 | $1,700,000 | $214,200 |
| 2020 | $10,069 | $1,914,200 | $1,700,000 | $214,200 |
| 2019 | $9,762 | $1,914,200 | $1,700,000 | $214,200 |
| 2018 | $9,341 | $1,914,200 | $1,700,000 | $214,200 |
| 2017 | $10,084 | $1,813,600 | $1,600,000 | $213,600 |
| 2016 | $9,975 | $1,813,600 | $1,600,000 | $213,600 |
| 2015 | $9,812 | $1,813,600 | $1,600,000 | $213,600 |
| 2014 | $9,703 | $1,813,600 | $1,600,000 | $213,600 |
Source: Public Records
Map
Nearby Homes