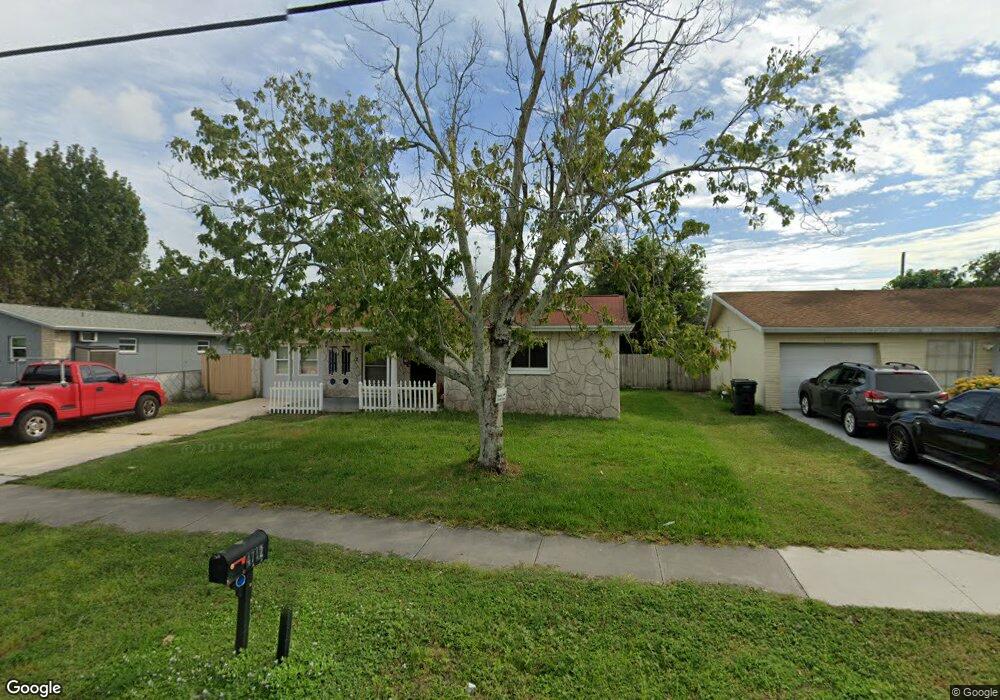
4712 58th Ave N Saint Petersburg, FL 33714
Estimated Value: $335,420 - $381,000
3
Beds
2
Baths
1,928
Sq Ft
$183/Sq Ft
Est. Value
About This Home
This home is located at 4712 58th Ave N, Saint Petersburg, FL 33714 and is currently estimated at $352,605, approximately $182 per square foot. 4712 58th Ave N is a home located in Pinellas County with nearby schools including Lealman Avenue Elementary School, Pinellas Park Middle School, and Hollins High School.
Ownership History
Date
Name
Owned For
Owner Type
Purchase Details
Closed on
Dec 28, 2017
Sold by
Vanvanlam Hung Van
Bought by
Vo Son and Lam Hanh
Current Estimated Value
Purchase Details
Closed on
Sep 27, 2016
Sold by
Sass Carolyn
Bought by
Vanvanlam Hung Van
Purchase Details
Closed on
Mar 16, 2015
Sold by
Sass Carl
Bought by
Sass Carolyn
Purchase Details
Closed on
Sep 5, 2002
Sold by
Sass Bertha H
Bought by
Sass Carl F and Sass Carolyn M
Home Financials for this Owner
Home Financials are based on the most recent Mortgage that was taken out on this home.
Original Mortgage
$104,400
Interest Rate
6.31%
Mortgage Type
New Conventional
Purchase Details
Closed on
Apr 14, 1994
Sold by
Phillips Thomas
Bought by
Sass Carl F and Sass Bertha H
Home Financials for this Owner
Home Financials are based on the most recent Mortgage that was taken out on this home.
Original Mortgage
$38,750
Interest Rate
7.47%
Mortgage Type
FHA
Create a Home Valuation Report for This Property
The Home Valuation Report is an in-depth analysis detailing your home's value as well as a comparison with similar homes in the area
Home Values in the Area
Average Home Value in this Area
Purchase History
| Date | Buyer | Sale Price | Title Company |
|---|---|---|---|
| Vo Son | -- | Attorney | |
| Vanvanlam Hung Van | $137,000 | None Available | |
| Sass Carolyn | -- | None Available | |
| Sass Carl F | -- | -- | |
| Sass Carl F | $58,000 | -- |
Source: Public Records
Mortgage History
| Date | Status | Borrower | Loan Amount |
|---|---|---|---|
| Previous Owner | Sass Carl F | $104,400 | |
| Previous Owner | Sass Carl F | $60,898 | |
| Previous Owner | Sass Carl F | $38,750 |
Source: Public Records
Tax History Compared to Growth
Tax History
| Year | Tax Paid | Tax Assessment Tax Assessment Total Assessment is a certain percentage of the fair market value that is determined by local assessors to be the total taxable value of land and additions on the property. | Land | Improvement |
|---|---|---|---|---|
| 2024 | $5,054 | $271,672 | $117,442 | $154,230 |
| 2023 | $5,054 | $233,929 | $108,869 | $125,060 |
| 2022 | $4,607 | $203,198 | $105,034 | $98,164 |
| 2021 | $4,248 | $160,296 | $0 | $0 |
| 2020 | $4,148 | $154,563 | $0 | $0 |
| 2019 | $4,127 | $152,667 | $56,278 | $96,389 |
| 2018 | $3,978 | $145,795 | $0 | $0 |
| 2017 | $3,629 | $130,366 | $0 | $0 |
| 2016 | $1,549 | $91,568 | $0 | $0 |
| 2015 | $1,501 | $90,931 | $0 | $0 |
| 2014 | $1,487 | $90,209 | $0 | $0 |
Source: Public Records
Map
Nearby Homes
- 0 4oth Ave N
- 4489 57th Ave N
- 4405 55th Ave N
- 5183 Orange Blossom Ln N
- 5755 43rd St N
- 5831 42nd Way N
- 4500 51st Ct N
- 5710 42nd St N
- 4205 57th Ave N
- 5429 57th Ave N
- 4676 66th Place N
- 4485 49th Ave N
- 4753 48th Ave N
- 4106 56th Ave N
- 5515 57th Ave N
- 4581 67th Ave N
- 4742 68th Terrace N
- 4036 56th Ave N
- 6771 46th Ln N
- 5563 58th St N
- 4724 58th Ave N
- 4713 57th Terrace N
- 4736 58th Ave N
- 4701 57th Terrace N
- 4725 57th Terrace N
- 4693 57th Terrace N
- 4737 57th Terrace N
- 4748 58th Ave N
- 4749 57th Terrace N
- 4681 57th Terrace N
- 4760 58th Ave N
- 4761 57th Terrace N
- 4714 57th Terrace N
- 4728 57th Terrace N
- 4700 57th Terrace N
- 5795 Lown St N
- 4772 58th Ave N
- 4742 57th Terrace N
- 4773 57th Terrace N
- 5780 Lown St N