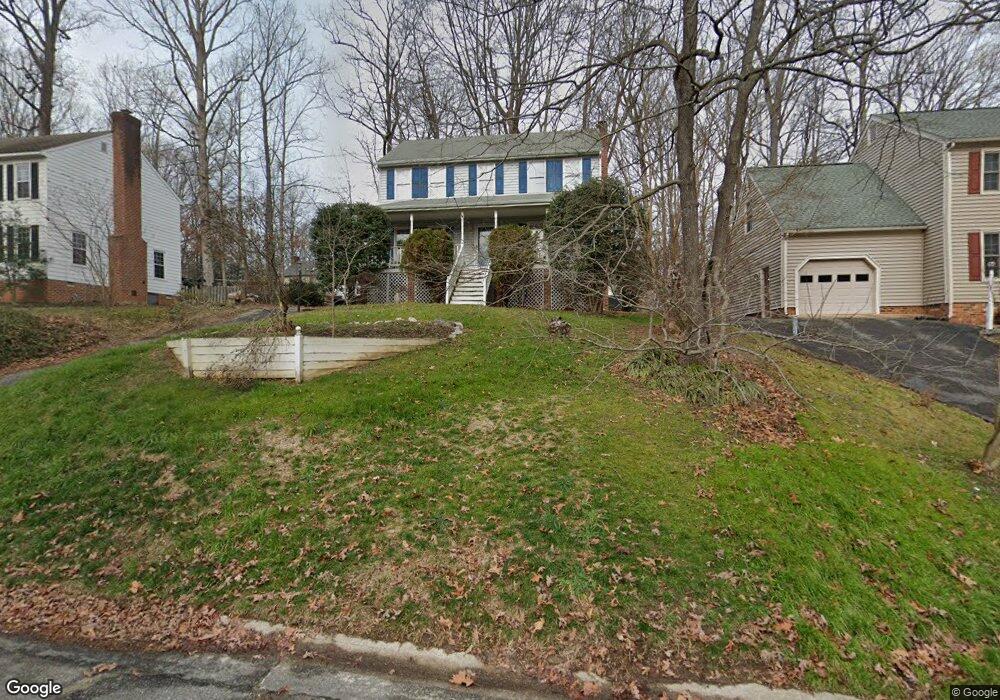
4713 Cedar Cliff Rd Chester, VA 23831
Estimated Value: $310,981 - $367,000
3
Beds
3
Baths
1,632
Sq Ft
$211/Sq Ft
Est. Value
About This Home
This home is located at 4713 Cedar Cliff Rd, Chester, VA 23831 and is currently estimated at $344,495, approximately $211 per square foot. 4713 Cedar Cliff Rd is a home located in Chesterfield County with nearby schools including C.C. Wells Elementary School, George W. Carver Middle School, and Thomas Dale High School - Main Campus.
Ownership History
Date
Name
Owned For
Owner Type
Purchase Details
Closed on
Aug 1, 2003
Sold by
Jones Carlton
Bought by
Driver Heath
Current Estimated Value
Home Financials for this Owner
Home Financials are based on the most recent Mortgage that was taken out on this home.
Original Mortgage
$116,800
Outstanding Balance
$50,159
Interest Rate
5.28%
Mortgage Type
New Conventional
Estimated Equity
$294,336
Purchase Details
Closed on
Jul 10, 2001
Bought by
Jones Carlton L and Jones Julie A
Home Financials for this Owner
Home Financials are based on the most recent Mortgage that was taken out on this home.
Original Mortgage
$121,176
Interest Rate
7.21%
Mortgage Type
FHA
Purchase Details
Closed on
Aug 16, 2000
Sold by
Moore Edward H
Bought by
Jones Carlton L and Bailey Julie A
Home Financials for this Owner
Home Financials are based on the most recent Mortgage that was taken out on this home.
Original Mortgage
$121,933
Interest Rate
8.13%
Mortgage Type
FHA
Create a Home Valuation Report for This Property
The Home Valuation Report is an in-depth analysis detailing your home's value as well as a comparison with similar homes in the area
Home Values in the Area
Average Home Value in this Area
Purchase History
| Date | Buyer | Sale Price | Title Company |
|---|---|---|---|
| Driver Heath | $146,000 | -- | |
| Jones Carlton L | -- | -- | |
| Jones Carlton L | $122,000 | -- |
Source: Public Records
Mortgage History
| Date | Status | Borrower | Loan Amount |
|---|---|---|---|
| Open | Jones Carlton L | $116,800 | |
| Previous Owner | Jones Carlton L | $121,176 | |
| Previous Owner | Jones Carlton L | $121,933 |
Source: Public Records
Tax History
| Year | Tax Paid | Tax Assessment Tax Assessment Total Assessment is a certain percentage of the fair market value that is determined by local assessors to be the total taxable value of land and additions on the property. | Land | Improvement |
|---|---|---|---|---|
| 2025 | $2,451 | $272,600 | $64,000 | $208,600 |
| 2024 | $2,451 | $266,000 | $64,000 | $202,000 |
| 2023 | $2,253 | $247,600 | $64,000 | $183,600 |
| 2022 | $2,114 | $229,800 | $61,000 | $168,800 |
| 2021 | $2,045 | $208,300 | $59,000 | $149,300 |
| 2020 | $1,945 | $204,700 | $59,000 | $145,700 |
| 2019 | $1,825 | $192,100 | $58,000 | $134,100 |
| 2018 | $1,794 | $188,800 | $57,000 | $131,800 |
| 2017 | $1,701 | $177,200 | $56,000 | $121,200 |
| 2016 | $1,651 | $172,000 | $54,000 | $118,000 |
| 2015 | $1,657 | $170,000 | $54,000 | $116,000 |
| 2014 | $1,615 | $165,600 | $54,000 | $111,600 |
Source: Public Records
Map
Nearby Homes
- 4608 Stoney Creek Pkwy
- 13909 Highpaige Way
- 4119 White Creek Cir
- 14012 Lippingham Terrace
- 4603 Edenton Place
- 13335 Happy Hill Rd
- 14419 Beachmere Dr
- 4506 Cara Hill Ln
- 4605 Greenbriar Dr
- 5225 Timsbury Pointe Dr
- 5343 Nairn Ln
- 4101 Sunset Ave
- 13124 Old Happy Hill Rd
- 13225 Old Happy Hill Rd
- 13101 Harrowgate Rd
- 13012 Harrowgate Rd
- 4400 Treely Rd
- 4520 Crossgate Rd
- 3924 Belspring Rd
- 3113 Ramsey Dr
- 4709 Cedar Cliff Rd
- 13709 Cedar Cliff Terrace
- 13710 Cedar Cliff Terrace
- 4705 Cedar Cliff Rd
- 4725 Cedar Cliff Rd
- 4712 Cedar Cliff Rd
- 4716 Cedar Cliff Rd
- 13708 Cedar Cliff Terrace
- 13707 Cedar Cliff Terrace
- 4720 Cedar Cliff Rd
- 4739 Cedar Cliff Rd
- 4704 Cedar Cliff Rd
- 4701 Cedar Cliff Rd
- 5019 Cedar Cliff Rd
- 4743 Cedar Cliff Rd
- 4724 Cedar Cliff Rd
- 4700 Cedar Cliff Rd
- 13706 Cedar Cliff Terrace
- 4700 Cedar Cliff Rd
- 13903 Twin Cliffs Ln
Your Personal Tour Guide
Ask me questions while you tour the home.