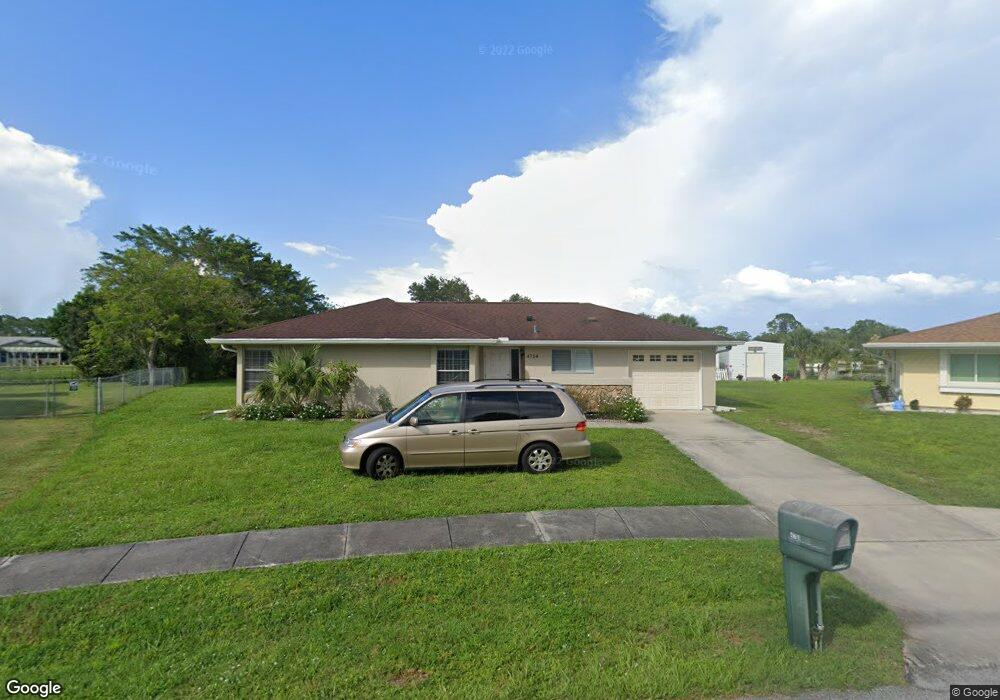
4714 Batchelor Ave North Port, FL 34287
Estimated Value: $242,000 - $296,000
2
Beds
2
Baths
1,767
Sq Ft
$147/Sq Ft
Est. Value
About This Home
This home is located at 4714 Batchelor Ave, North Port, FL 34287 and is currently estimated at $259,325, approximately $146 per square foot. 4714 Batchelor Ave is a home located in Sarasota County with nearby schools including North Port High School, Cranberry Elementary School, and Heron Creek Middle School.
Ownership History
Date
Name
Owned For
Owner Type
Purchase Details
Closed on
Nov 1, 2017
Sold by
Ishkov Tatyana
Bought by
Ishkov Tatyana Vsevolodovn and Ishkov Paul
Current Estimated Value
Home Financials for this Owner
Home Financials are based on the most recent Mortgage that was taken out on this home.
Original Mortgage
$80,389
Outstanding Balance
$67,327
Interest Rate
3.83%
Mortgage Type
New Conventional
Estimated Equity
$191,998
Purchase Details
Closed on
Jun 29, 2015
Sold by
Fannie Mae
Bought by
Ishkov Tatyana
Home Financials for this Owner
Home Financials are based on the most recent Mortgage that was taken out on this home.
Original Mortgage
$70,644
Interest Rate
3.89%
Mortgage Type
Amount Keyed Is An Aggregate Amount
Purchase Details
Closed on
Apr 28, 2015
Sold by
Tomlinson Theresa A and Tomlinson Errol M
Bought by
Federal National Mortgage Association
Create a Home Valuation Report for This Property
The Home Valuation Report is an in-depth analysis detailing your home's value as well as a comparison with similar homes in the area
Home Values in the Area
Average Home Value in this Area
Purchase History
| Date | Buyer | Sale Price | Title Company |
|---|---|---|---|
| Ishkov Tatyana Vsevolodovn | -- | Siesta Title And Escrow Svcs | |
| Ishkov Tatyana | $112,000 | Attorney | |
| Federal National Mortgage Association | -- | None Available |
Source: Public Records
Mortgage History
| Date | Status | Borrower | Loan Amount |
|---|---|---|---|
| Open | Ishkov Tatyana Vsevolodovn | $80,389 | |
| Closed | Ishkov Tatyana | $70,644 |
Source: Public Records
Tax History Compared to Growth
Tax History
| Year | Tax Paid | Tax Assessment Tax Assessment Total Assessment is a certain percentage of the fair market value that is determined by local assessors to be the total taxable value of land and additions on the property. | Land | Improvement |
|---|---|---|---|---|
| 2024 | $2,081 | $136,563 | -- | -- |
| 2023 | $2,081 | $132,585 | $0 | $0 |
| 2022 | $2,020 | $128,723 | $0 | $0 |
| 2021 | $2,001 | $124,974 | $0 | $0 |
| 2020 | $1,987 | $123,249 | $0 | $0 |
| 2019 | $1,932 | $120,478 | $0 | $0 |
| 2018 | $1,794 | $118,232 | $0 | $0 |
| 2017 | $1,759 | $115,800 | $20,000 | $95,800 |
| 2016 | $2,227 | $105,800 | $18,300 | $87,500 |
| 2015 | $1,651 | $79,500 | $9,200 | $70,300 |
| 2014 | $1,400 | $46,900 | $0 | $0 |
Source: Public Records
Map
Nearby Homes
- 4655 Payne St
- 0 Ragen St
- 4806 Calah St
- 4424 Baroda Ave
- 3759 Santana St
- 4951 Pocatella Ave
- 5061 Richmond Terrace
- 5131 Appomattox Dr
- 4359 Pocatella Ave
- 3650 S Sumter Blvd
- 3880 Pinstar Terrace
- 5028 Greenway Ct
- 5052 Trekell St
- 0 Hadden Terrace Unit MFRC7515439
- 0 Wecoma Ave Unit MFRN6139012
- 0 Wecoma Ave Unit MFRO6303510
- 4716 Wecoma Ave
- LOT 16 BLK 266 Hadden Terrace
- 3927 Whispering Oaks Dr
- 0 Pinstar Terrace
- 4634 Payne St
- 4734 Batchelor Ave
- 4754 Batchelor Ave
- 4654 Payne St
- 4615 Payne St
- 4749 Sans Souci Ave
- 4727 Sans Souci Ave
- 4025 Fontainebleau St
- 4774 Batchelor Ave
- 4674 Payne St
- 4033 Fontainebleau St
- 4771 Sans Souci Ave
- 4695 Payne St
- 4793 Sans Souci Ave
- 4017 Fontainebleau St
- 4804 Batchelor Ave
- 4803 Batchelor Ave
- 4056 Beeber St
- 4700 Payne St
- 4041 Fontainebleau St