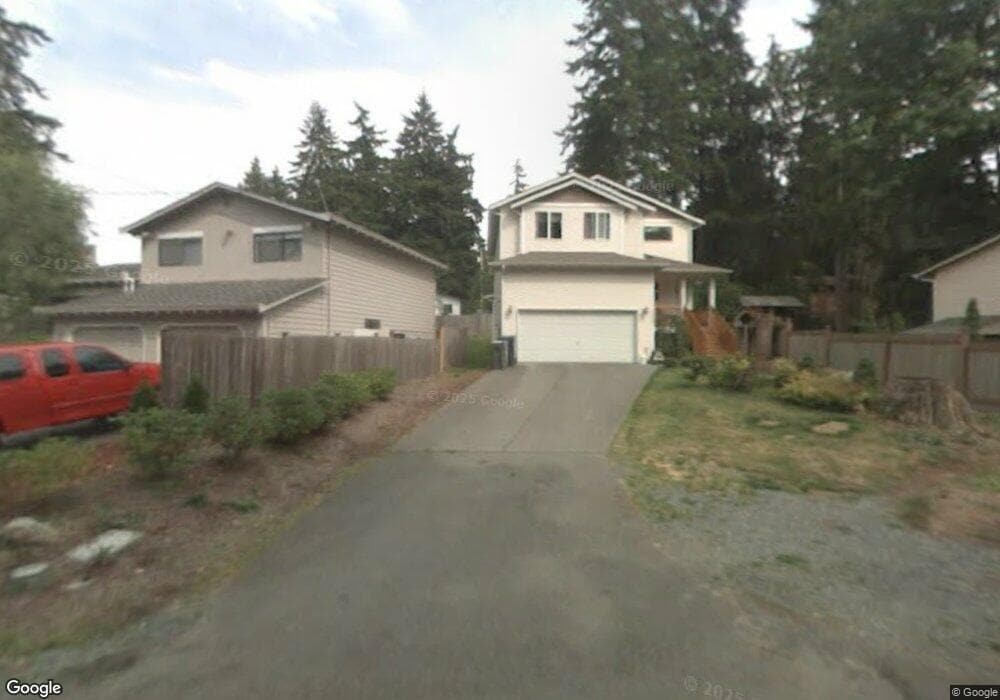
4714 Picnic Point Rd Edmonds, WA 98026
Estimated Value: $858,000 - $942,000
4
Beds
3
Baths
2,102
Sq Ft
$425/Sq Ft
Est. Value
About This Home
This home is located at 4714 Picnic Point Rd, Edmonds, WA 98026 and is currently estimated at $892,762, approximately $424 per square foot. 4714 Picnic Point Rd is a home located in Snohomish County with nearby schools including Picnic Point Elementary School, Harbour Pointe Middle School, and Kamiak High School.
Ownership History
Date
Name
Owned For
Owner Type
Purchase Details
Closed on
Oct 7, 2021
Sold by
Benedict Steven R
Bought by
Benedict Lisa M
Current Estimated Value
Purchase Details
Closed on
Nov 16, 2006
Sold by
Sill Anina Coder
Bought by
Benedict Steven R and Reed Lisa M
Home Financials for this Owner
Home Financials are based on the most recent Mortgage that was taken out on this home.
Original Mortgage
$75,000
Interest Rate
5.96%
Mortgage Type
Stand Alone Second
Purchase Details
Closed on
Dec 2, 1997
Sold by
Kimball Patricia L
Bought by
Coder Robert H and Coder Laurel L
Home Financials for this Owner
Home Financials are based on the most recent Mortgage that was taken out on this home.
Original Mortgage
$60,000
Interest Rate
7.31%
Create a Home Valuation Report for This Property
The Home Valuation Report is an in-depth analysis detailing your home's value as well as a comparison with similar homes in the area
Home Values in the Area
Average Home Value in this Area
Purchase History
| Date | Buyer | Sale Price | Title Company |
|---|---|---|---|
| Benedict Lisa M | -- | None Available | |
| Benedict Steven R | $375,000 | Rainier Title | |
| Coder Robert H | $206,490 | -- |
Source: Public Records
Mortgage History
| Date | Status | Borrower | Loan Amount |
|---|---|---|---|
| Previous Owner | Benedict Steven R | $75,000 | |
| Previous Owner | Benedict Steven R | $300,000 | |
| Previous Owner | Coder Robert H | $60,000 |
Source: Public Records
Tax History
| Year | Tax Paid | Tax Assessment Tax Assessment Total Assessment is a certain percentage of the fair market value that is determined by local assessors to be the total taxable value of land and additions on the property. | Land | Improvement |
|---|---|---|---|---|
| 2026 | $5,994 | $779,000 | $551,000 | $228,000 |
| 2025 | $5,943 | $702,500 | $485,000 | $217,500 |
| 2024 | $5,943 | $702,500 | $485,000 | $217,500 |
| 2023 | $5,947 | $734,800 | $495,000 | $239,800 |
| 2022 | $5,516 | $576,500 | $373,000 | $203,500 |
| 2020 | $4,714 | $479,100 | $301,000 | $178,100 |
| 2019 | $4,502 | $459,400 | $283,000 | $176,400 |
| 2018 | $4,559 | $405,800 | $246,000 | $159,800 |
| 2017 | $4,013 | $365,100 | $221,000 | $144,100 |
| 2016 | $3,770 | $340,400 | $200,000 | $140,400 |
| 2015 | $3,653 | $301,800 | $160,000 | $141,800 |
| 2013 | $3,061 | $236,000 | $119,000 | $117,000 |
Source: Public Records
Map
Nearby Homes
- 13717 46th Ave W
- 13716 50th Ave W
- 4314 137th Place SW
- 14329 43rd Ave W
- 5310 144th Place SW
- 13814 41st Ave W
- 14722 45th Place W
- 5503 138th Place SW
- 14807 50th Ave W
- 14714 53rd Ave W Unit 104
- 5020 148th St SW Unit B5
- 5020 148th St SW Unit B1
- 14916 48th Ave W
- 13124 44th Ave W
- 14913 48th Ave W Unit K-1
- 14913 48th Ave W Unit N-2
- 4813 150th Place SW
- 13318 Beverly Park Rd
- 3821 Shelby Rd
- 14925 44th Ave W Unit A4
- 4720 Picnic Point Rd
- 4712 Picnic Point Rd
- 4710 Picnic Point Rd
- 4725 142nd Place SW
- 4812 Picnic Point Rd
- 4802 Picnic Point Rd
- 4808 Picnic Point Rd
- 4808 Picnic Point Rd
- 4708 Picnic Point Rd
- 4731 142nd Place SW Unit A&B
- 4731 142nd Place SW
- 4820 Picnic Point Rd
- 4719 142nd Place SW
- 14118 Beverly Park Rd Unit B
- 14114 Beverly Park Rd Unit B
- 14114 Beverly Park Rd Unit A
- 4816 Picnic Point Rd
- 14210 Beverly Park Rd
- 14210 Beverly Park Rd Unit A
Your Personal Tour Guide
Ask me questions while you tour the home.