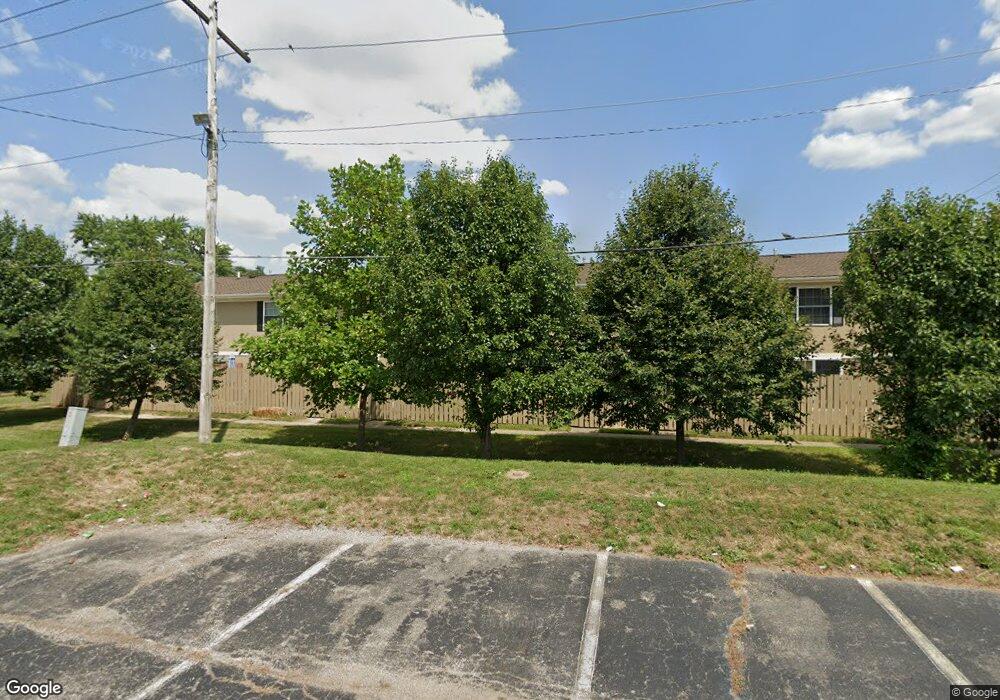
4714 Tarryton Ct S Unit 1D Columbus, OH 43228
Estimated Value: $67,000 - $79,000
1
Bed
1
Bath
784
Sq Ft
$94/Sq Ft
Est. Value
About This Home
This home is located at 4714 Tarryton Ct S Unit 1D, Columbus, OH 43228 and is currently estimated at $73,464, approximately $93 per square foot. 4714 Tarryton Ct S Unit 1D is a home located in Franklin County with nearby schools including Prairie Lincoln Elementary School, Galloway Ridge Intermediate School, and Norton Middle School.
Ownership History
Date
Name
Owned For
Owner Type
Purchase Details
Closed on
Jul 16, 2024
Sold by
Nguyen Phuong
Bought by
Mason Supriyanto
Current Estimated Value
Purchase Details
Closed on
May 12, 2023
Sold by
Addae Kevin Kwadwo and Nana Aba
Bought by
Nguyen Phuong
Purchase Details
Closed on
Mar 26, 2021
Sold by
Gil Ronald Arteaga
Bought by
Addae Kevin Kwadwo and Akafia Ivory Nana
Purchase Details
Closed on
Feb 10, 2020
Sold by
Lee Aaron F
Bought by
Gil Ronald Arteaga
Purchase Details
Closed on
Jan 5, 2005
Sold by
Allen Terrance R and Allen Alma Jean
Bought by
Lee Aaron F
Home Financials for this Owner
Home Financials are based on the most recent Mortgage that was taken out on this home.
Original Mortgage
$28,850
Interest Rate
6%
Mortgage Type
Purchase Money Mortgage
Purchase Details
Closed on
Sep 17, 2004
Sold by
Fullwiler John T
Bought by
Allen Terrance R and Allen Alma Jean
Purchase Details
Closed on
Jul 20, 1993
Create a Home Valuation Report for This Property
The Home Valuation Report is an in-depth analysis detailing your home's value as well as a comparison with similar homes in the area
Home Values in the Area
Average Home Value in this Area
Purchase History
| Date | Buyer | Sale Price | Title Company |
|---|---|---|---|
| Mason Supriyanto | $68,000 | Search2close | |
| Nguyen Phuong | $70,000 | Vault Title | |
| Addae Kevin Kwadwo | $50,500 | Accommodation | |
| Gil Ronald Arteaga | $19,800 | Total Title Services Llc | |
| Lee Aaron F | $28,900 | Independent Title | |
| Allen Terrance R | $15,000 | Independent | |
| -- | $12,000 | -- |
Source: Public Records
Mortgage History
| Date | Status | Borrower | Loan Amount |
|---|---|---|---|
| Previous Owner | Lee Aaron F | $28,850 |
Source: Public Records
Tax History Compared to Growth
Tax History
| Year | Tax Paid | Tax Assessment Tax Assessment Total Assessment is a certain percentage of the fair market value that is determined by local assessors to be the total taxable value of land and additions on the property. | Land | Improvement |
|---|---|---|---|---|
| 2024 | $1,135 | $18,490 | $1,230 | $17,260 |
| 2023 | $860 | $18,490 | $1,230 | $17,260 |
| 2022 | $674 | $10,020 | $1,090 | $8,930 |
| 2021 | $684 | $10,020 | $1,090 | $8,930 |
| 2020 | $925 | $10,020 | $1,090 | $8,930 |
| 2019 | $1,278 | $7,700 | $840 | $6,860 |
| 2018 | $517 | $7,700 | $840 | $6,860 |
| 2017 | $550 | $7,700 | $840 | $6,860 |
| 2016 | $456 | $5,750 | $880 | $4,870 |
| 2015 | $456 | $5,750 | $880 | $4,870 |
| 2014 | $420 | $5,750 | $880 | $4,870 |
| 2013 | $256 | $6,720 | $1,015 | $5,705 |
Source: Public Records
Map
Nearby Homes
- 127 Tarryton Ct W Unit 23D
- 141 Beacon Run W Unit 26E
- 4696 Tarryton Ct S Unit 7-2D
- 74 Tarryton Ct E Unit 10A
- 218 Darbyhurst Rd
- 271 Carilla Ln
- 4637 Hilton Ave
- 4589 Annhurst Rd
- 316 Sturbridge Rd
- 299 Lombard Rd
- 264 Woodlawn Ave
- 450 Lawrence Ave
- 4778 Hafey Ave
- 429 Postle Blvd
- 5006 Old Tree Ave
- 5409 Longworth Dr
- 5504 Inglecrest Place
- 4950 Cherry Creek Pkwy S
- 4220 Atlanta Dr
- 4848 Deephollow Dr
- 4714 Tarryton Ct S Unit 2K
- 4714 Tarryton Ct S Unit 3K
- 4714 Tarryton Ct S
- 4714 Tarryton Ct S
- 4714 Tarryton Ct S Unit 202H
- 4714 Tarryton Ct S Unit 1F
- 4714 Tarryton Ct S Unit 2J
- 4714 Tarryton Ct S
- 4714 Tarryton Ct S Unit 3E
- 4714 Tarryton Ct S Unit 2F
- 4714 Tarryton Ct S
- 4714 Tarryton Ct S
- 4714 Tarryton Ct S
- 4714 Tarryton Ct S
- 4714 Tarryton Ct S
- 4714 Tarryton Ct S
- 4714 Tarryton Ct S Unit 3B
- 4714 Tarryton Ct S
- 4714 Tarryton Ct S
- 4714 Tarryton Ct S