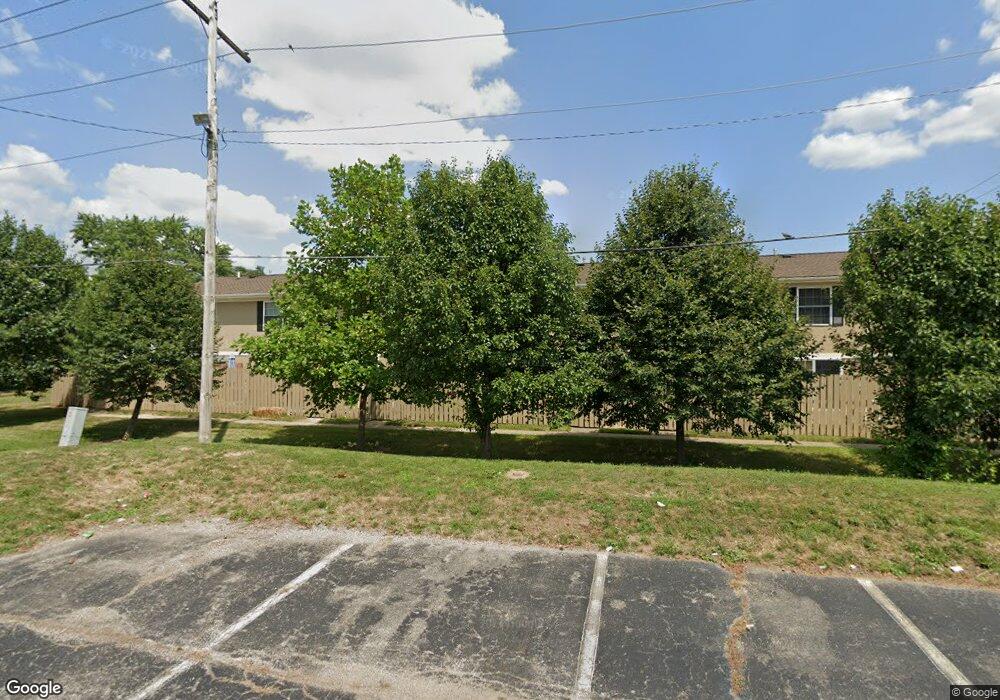
4714 Tarryton Ct S Unit 1F Columbus, OH 43228
Estimated Value: $67,000 - $79,000
1
Bed
1
Bath
784
Sq Ft
$94/Sq Ft
Est. Value
About This Home
This home is located at 4714 Tarryton Ct S Unit 1F, Columbus, OH 43228 and is currently estimated at $74,084, approximately $94 per square foot. 4714 Tarryton Ct S Unit 1F is a home located in Franklin County with nearby schools including Prairie Lincoln Elementary School, Galloway Ridge Intermediate School, and Norton Middle School.
Ownership History
Date
Name
Owned For
Owner Type
Purchase Details
Closed on
Nov 14, 2023
Sold by
Sheriff Of Franklin County Ohio
Bought by
Crissinger Jon
Current Estimated Value
Purchase Details
Closed on
Feb 24, 2003
Sold by
Chew James R
Bought by
Aycock Terrence A
Home Financials for this Owner
Home Financials are based on the most recent Mortgage that was taken out on this home.
Original Mortgage
$19,000
Interest Rate
5.38%
Mortgage Type
Purchase Money Mortgage
Purchase Details
Closed on
May 8, 2001
Sold by
Hyden Marji L and Hyden Scott A
Bought by
Chew James R
Purchase Details
Closed on
Oct 27, 1999
Sold by
Garwood Dennis R
Bought by
Hyden Marji L and Plants Traci J
Purchase Details
Closed on
Oct 3, 1977
Bought by
Garwood Dennis R
Create a Home Valuation Report for This Property
The Home Valuation Report is an in-depth analysis detailing your home's value as well as a comparison with similar homes in the area
Home Values in the Area
Average Home Value in this Area
Purchase History
| Date | Buyer | Sale Price | Title Company |
|---|---|---|---|
| Crissinger Jon | $69,400 | None Listed On Document | |
| Aycock Terrence A | $20,000 | Chicago Title | |
| Chew James R | $15,000 | Warranty Title | |
| Hyden Marji L | -- | -- | |
| Garwood Dennis R | -- | -- |
Source: Public Records
Mortgage History
| Date | Status | Borrower | Loan Amount |
|---|---|---|---|
| Previous Owner | Aycock Terrence A | $19,000 |
Source: Public Records
Tax History Compared to Growth
Tax History
| Year | Tax Paid | Tax Assessment Tax Assessment Total Assessment is a certain percentage of the fair market value that is determined by local assessors to be the total taxable value of land and additions on the property. | Land | Improvement |
|---|---|---|---|---|
| 2024 | $1,419 | $18,490 | $1,230 | $17,260 |
| 2023 | $3,106 | $18,490 | $1,230 | $17,260 |
| 2022 | $5,220 | $10,020 | $1,090 | $8,930 |
| 2021 | $1,781 | $10,020 | $1,090 | $8,930 |
| 2020 | $1,613 | $10,020 | $1,090 | $8,930 |
| 2019 | $852 | $7,700 | $840 | $6,860 |
| 2018 | $289 | $7,700 | $840 | $6,860 |
| 2017 | $514 | $7,700 | $840 | $6,860 |
| 2016 | $456 | $5,750 | $880 | $4,870 |
| 2015 | $228 | $5,750 | $880 | $4,870 |
| 2014 | $420 | $5,750 | $880 | $4,870 |
| 2013 | $256 | $6,720 | $1,015 | $5,705 |
Source: Public Records
Map
Nearby Homes
- 127 Tarryton Ct W Unit 23D
- 141 Beacon Run W Unit 26E
- 4696 Tarryton Ct S Unit 7-2D
- 74 Tarryton Ct E Unit 10A
- 218 Darbyhurst Rd
- 271 Carilla Ln
- 4637 Hilton Ave
- 4589 Annhurst Rd
- 299 Lombard Rd
- 264 Woodlawn Ave
- 435 Redmond Rd
- 450 Lawrence Ave
- 4778 Hafey Ave
- 429 Postle Blvd
- 5006 Old Tree Ave
- 5409 Longworth Dr
- 5504 Inglecrest Place
- 4950 Cherry Creek Pkwy S
- 4220 Atlanta Dr
- 4848 Deephollow Dr
- 4714 Tarryton Ct S Unit 2K
- 4714 Tarryton Ct S Unit 3K
- 4714 Tarryton Ct S Unit 1D
- 4714 Tarryton Ct S
- 4714 Tarryton Ct S
- 4714 Tarryton Ct S Unit 202H
- 4714 Tarryton Ct S Unit 2J
- 4714 Tarryton Ct S
- 4714 Tarryton Ct S Unit 3E
- 4714 Tarryton Ct S Unit 2F
- 4714 Tarryton Ct S
- 4714 Tarryton Ct S
- 4714 Tarryton Ct S
- 4714 Tarryton Ct S
- 4714 Tarryton Ct S
- 4714 Tarryton Ct S
- 4714 Tarryton Ct S Unit 3B
- 4714 Tarryton Ct S
- 4714 Tarryton Ct S
- 4714 Tarryton Ct S