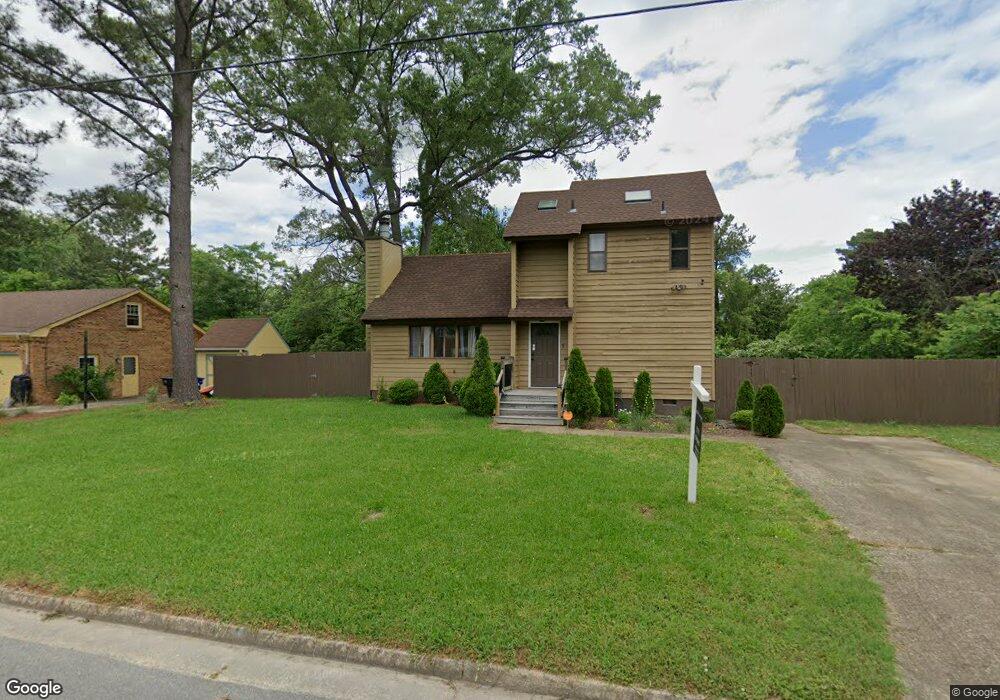
4714 Thornwood St Portsmouth, VA 23703
Churchland NeighborhoodEstimated Value: $246,000 - $309,616
2
Beds
2
Baths
1,264
Sq Ft
$225/Sq Ft
Est. Value
About This Home
This home is located at 4714 Thornwood St, Portsmouth, VA 23703 and is currently estimated at $284,654, approximately $225 per square foot. 4714 Thornwood St is a home located in Portsmouth City with nearby schools including Churchland Elementary School, Churchland Academy Elementary School, and Churchland Middle School.
Ownership History
Date
Name
Owned For
Owner Type
Purchase Details
Closed on
Aug 19, 2020
Sold by
Lawrence Kevin E
Bought by
Graf Jordan
Current Estimated Value
Home Financials for this Owner
Home Financials are based on the most recent Mortgage that was taken out on this home.
Original Mortgage
$145,500
Outstanding Balance
$128,534
Interest Rate
2.9%
Mortgage Type
New Conventional
Estimated Equity
$156,120
Purchase Details
Closed on
Feb 6, 2008
Sold by
Mckay Nan E
Bought by
Vecere Tristan J
Home Financials for this Owner
Home Financials are based on the most recent Mortgage that was taken out on this home.
Original Mortgage
$207,364
Interest Rate
6.2%
Mortgage Type
VA
Purchase Details
Closed on
Oct 7, 2004
Sold by
Cogan Carl
Bought by
Mckay Nan
Home Financials for this Owner
Home Financials are based on the most recent Mortgage that was taken out on this home.
Original Mortgage
$116,000
Interest Rate
5.8%
Mortgage Type
New Conventional
Create a Home Valuation Report for This Property
The Home Valuation Report is an in-depth analysis detailing your home's value as well as a comparison with similar homes in the area
Home Values in the Area
Average Home Value in this Area
Purchase History
| Date | Buyer | Sale Price | Title Company |
|---|---|---|---|
| Graf Jordan | $150,000 | Insight Title & Settlement | |
| Vecere Tristan J | $203,000 | -- | |
| Mckay Nan | $145,000 | -- |
Source: Public Records
Mortgage History
| Date | Status | Borrower | Loan Amount |
|---|---|---|---|
| Open | Graf Jordan | $145,500 | |
| Previous Owner | Vecere Tristan J | $207,364 | |
| Previous Owner | Mckay Nan | $116,000 |
Source: Public Records
Tax History Compared to Growth
Tax History
| Year | Tax Paid | Tax Assessment Tax Assessment Total Assessment is a certain percentage of the fair market value that is determined by local assessors to be the total taxable value of land and additions on the property. | Land | Improvement |
|---|---|---|---|---|
| 2025 | $3,507 | $274,960 | $106,200 | $168,760 |
| 2024 | $3,507 | $271,220 | $106,200 | $165,020 |
| 2023 | $3,141 | $251,240 | $106,200 | $145,040 |
| 2022 | $3,036 | $233,540 | $88,500 | $145,040 |
| 2021 | $2,622 | $201,710 | $56,670 | $145,040 |
| 2020 | $2,392 | $184,020 | $53,970 | $130,050 |
| 2019 | $2,376 | $182,770 | $53,970 | $128,800 |
| 2018 | $2,387 | $183,610 | $53,970 | $129,640 |
| 2017 | $2,109 | $162,210 | $53,970 | $108,240 |
| 2016 | $2,109 | $162,210 | $53,970 | $108,240 |
| 2015 | $2,109 | $162,210 | $53,970 | $108,240 |
| 2014 | $2,060 | $162,210 | $53,970 | $108,240 |
Source: Public Records
Map
Nearby Homes
- 3613 Cardinal Ln
- 4808 Thornwood St
- 3728 Cardinal Ln
- 3609 Loon Ct
- 3609 Linnet Ln
- 2004 Sawgrass Ln
- 4705 Templar Dr
- 4412 Carlton Ct
- 4613 Mallard Crescent
- 3408 Wakefield Dr
- 4955 Briarwood Ln
- 4959 Briarwood Ln
- 3405 Canterbury Dr
- 3832 New River Reach Unit A
- 4313 Templar Dr
- 3425 Cedar Ln
- 3614 Jordan Ln
- 3509 Spence Rd
- 3812 Falling River Reach Unit C
- 50 Centre Port Cir
- 4716 Thornwood St
- 4712 Thornwood St
- 4713 Thornwood St
- 4717 Thornwood St
- 4710 Thornwood St
- 4718 Thornwood St
- 4709 Thornwood St
- 7 Starling Ct
- 5 Starling Ct
- 4719 Thornwood St
- 3 Starling Ct
- 4705 Thornwood St
- 9 Starling Ct
- 4708 Thornwood St
- 4720 Thornwood St
- 1 Starling Ct
- 4706 Thornwood St
- 3620 Cardinal Ln
- 4721 Thornwood St
- 11 Starling Ct