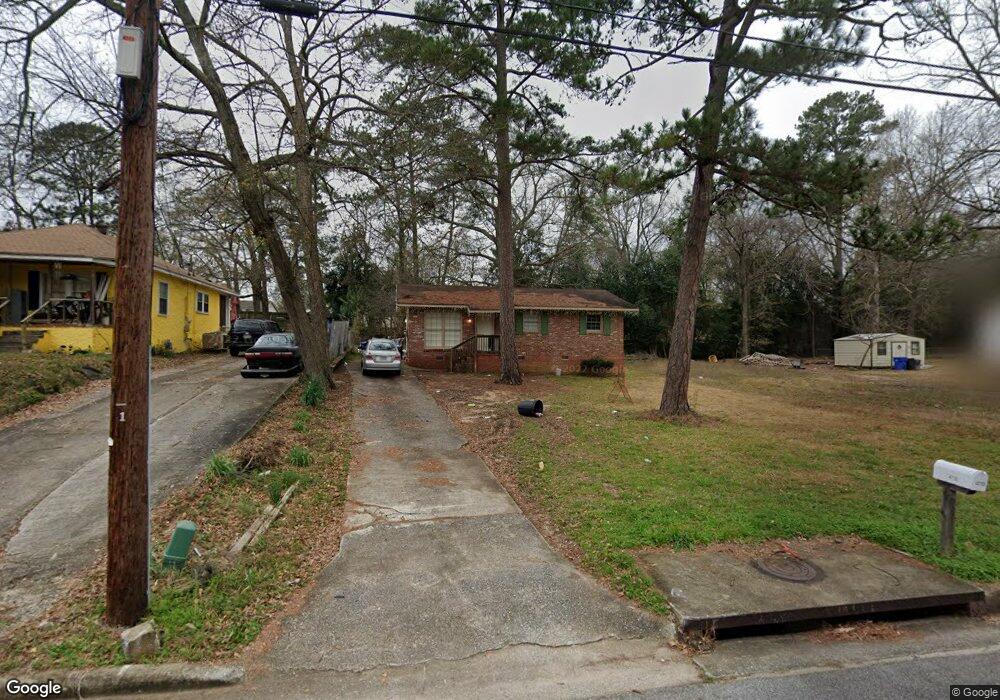
4715 17th Ave Columbus, GA 31904
Estimated Value: $55,000 - $95,339
3
Beds
2
Baths
975
Sq Ft
$76/Sq Ft
Est. Value
About This Home
This home is located at 4715 17th Ave, Columbus, GA 31904 and is currently estimated at $74,585, approximately $76 per square foot. 4715 17th Ave is a home located in Muscogee County with nearby schools including Allen Elementary School, Arnold Middle School, and Jordan Vocational High School.
Ownership History
Date
Name
Owned For
Owner Type
Purchase Details
Closed on
Dec 19, 2019
Sold by
Wiggins Robert
Bought by
The R D Valentini Co Llc
Current Estimated Value
Purchase Details
Closed on
Jun 26, 2013
Sold by
Wiggins Robert
Bought by
Valentini Richard D
Home Financials for this Owner
Home Financials are based on the most recent Mortgage that was taken out on this home.
Original Mortgage
$27,500
Interest Rate
3.79%
Mortgage Type
New Conventional
Purchase Details
Closed on
Nov 6, 2012
Sold by
Wells Fargo Bank
Bought by
Sec Of Veterans Affairs
Purchase Details
Closed on
Dec 20, 2007
Sold by
Hutchins Brent and Hutchins Ivette
Bought by
Phillips Brian M and Phillips Kimberly L
Home Financials for this Owner
Home Financials are based on the most recent Mortgage that was taken out on this home.
Original Mortgage
$83,000
Interest Rate
6.22%
Mortgage Type
VA
Create a Home Valuation Report for This Property
The Home Valuation Report is an in-depth analysis detailing your home's value as well as a comparison with similar homes in the area
Home Values in the Area
Average Home Value in this Area
Purchase History
| Date | Buyer | Sale Price | Title Company |
|---|---|---|---|
| The R D Valentini Co Llc | -- | -- | |
| Valentini Richard D | $33,500 | -- | |
| Wiggins Robert | $28,000 | -- | |
| Sec Of Veterans Affairs | -- | -- | |
| Wells Fargo Bank | -- | -- | |
| Phillips Brian M | $83,000 | None Available |
Source: Public Records
Mortgage History
| Date | Status | Borrower | Loan Amount |
|---|---|---|---|
| Previous Owner | Wiggins Robert | $27,500 | |
| Previous Owner | Phillips Brian M | $83,000 |
Source: Public Records
Tax History Compared to Growth
Tax History
| Year | Tax Paid | Tax Assessment Tax Assessment Total Assessment is a certain percentage of the fair market value that is determined by local assessors to be the total taxable value of land and additions on the property. | Land | Improvement |
|---|---|---|---|---|
| 2025 | $742 | $18,948 | $4,112 | $14,836 |
| 2024 | $742 | $18,948 | $4,112 | $14,836 |
| 2023 | $746 | $18,948 | $4,112 | $14,836 |
| 2022 | $582 | $14,248 | $4,112 | $10,136 |
| 2021 | $577 | $14,124 | $4,112 | $10,012 |
| 2020 | $577 | $14,124 | $4,112 | $10,012 |
| 2019 | $579 | $14,124 | $4,112 | $10,012 |
| 2018 | $815 | $23,412 | $8,224 | $15,188 |
| 2017 | $962 | $23,412 | $8,224 | $15,188 |
| 2016 | $553 | $13,401 | $3,682 | $9,719 |
| 2015 | $221 | $13,401 | $3,682 | $9,719 |
| 2014 | $554 | $13,401 | $3,682 | $9,719 |
| 2013 | -- | $33,187 | $3,682 | $29,505 |
Source: Public Records
Map
Nearby Homes
- 4830 17th Ave
- 4714 18th Ave
- 4814 20th Ave
- 2206 Devonshire Dr
- 4213 16th Ave
- 4220 18th Ave
- 1717 42nd St
- 4109 Sherwood Ave
- 2012 42nd St
- 2222 51st St
- 2323 Devonshire Dr
- 5106 11th Ave
- 5110 11th Ave
- 5118 11th Ave
- 1103 52nd St
- 1702 40th St
- 1703 39th St
- 2122 40th St
- 2119 Lancaster Dr
- 4214 Saint Francis Ave Unit A