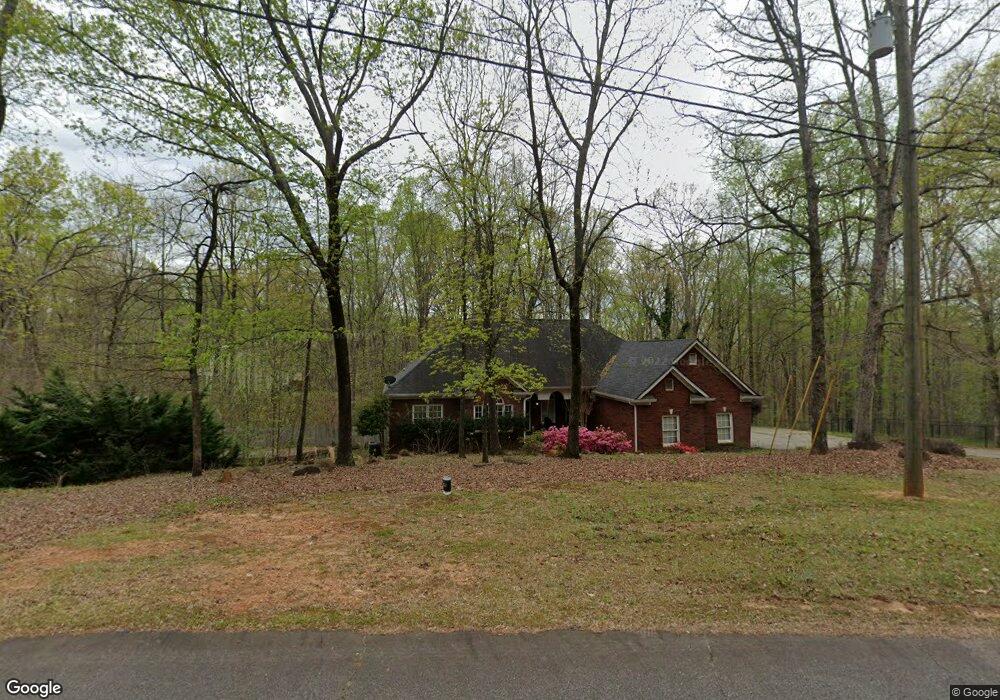
4715 Gateway Ln Unit 1 Flowery Branch, GA 30542
Estimated Value: $510,000 - $624,000
4
Beds
4
Baths
2,204
Sq Ft
$269/Sq Ft
Est. Value
About This Home
This home is located at 4715 Gateway Ln Unit 1, Flowery Branch, GA 30542 and is currently estimated at $591,846, approximately $268 per square foot. 4715 Gateway Ln Unit 1 is a home located in Hall County with nearby schools including Martin Elementary School, Southwest Middle School, and C.W. Davis Middle School.
Ownership History
Date
Name
Owned For
Owner Type
Purchase Details
Closed on
Aug 12, 2010
Sold by
Unyi Christine M
Bought by
Unyi Christine M
Current Estimated Value
Purchase Details
Closed on
May 22, 2007
Sold by
Unyi Christine M
Bought by
Unyi Christine M and Lopez John
Home Financials for this Owner
Home Financials are based on the most recent Mortgage that was taken out on this home.
Original Mortgage
$287,200
Interest Rate
6%
Mortgage Type
New Conventional
Create a Home Valuation Report for This Property
The Home Valuation Report is an in-depth analysis detailing your home's value as well as a comparison with similar homes in the area
Home Values in the Area
Average Home Value in this Area
Purchase History
| Date | Buyer | Sale Price | Title Company |
|---|---|---|---|
| Unyi Christine M | -- | -- | |
| Unyi Christine M | -- | -- | |
| Unyi Christine M | $359,000 | -- |
Source: Public Records
Mortgage History
| Date | Status | Borrower | Loan Amount |
|---|---|---|---|
| Previous Owner | Unyi Christine M | $287,200 | |
| Previous Owner | Unyi Christine M | $71,800 |
Source: Public Records
Tax History Compared to Growth
Tax History
| Year | Tax Paid | Tax Assessment Tax Assessment Total Assessment is a certain percentage of the fair market value that is determined by local assessors to be the total taxable value of land and additions on the property. | Land | Improvement |
|---|---|---|---|---|
| 2024 | $5,702 | $230,000 | $33,360 | $196,640 |
| 2023 | $4,023 | $177,800 | $14,200 | $163,600 |
| 2022 | $3,844 | $148,440 | $14,200 | $134,240 |
| 2021 | $3,792 | $143,760 | $14,200 | $129,560 |
| 2020 | $3,100 | $114,052 | $13,040 | $101,012 |
| 2019 | $3,127 | $114,052 | $13,040 | $101,012 |
| 2018 | $3,229 | $114,052 | $13,040 | $101,012 |
| 2017 | $3,196 | $114,052 | $13,040 | $101,012 |
| 2016 | $3,119 | $114,052 | $13,040 | $101,012 |
| 2015 | $3,144 | $114,052 | $13,040 | $101,012 |
| 2014 | $3,144 | $114,052 | $13,040 | $101,012 |
Source: Public Records
Map
Nearby Homes
- 4643 Wilderness Trail
- 4712 Wilderness Trail
- 4715 Wilderness Trail
- 4704 Wilderness Trail
- 4695 Wilderness Trail
- 4446 Union Church Rd
- 5055 Pointer Ridge
- 4621 Stanley Rd
- 5061 Pointer Ridge
- 4860 Wildlife Way
- 4559 Winder Hwy
- 5049 Holly Hock Dr
- 4626 Deer Creek Ct
- 4577 Winder Hwy
- 4743 Amsterdam Ln
- 4838 Netherlands Place
- 4640 Steeplechase Ln Unit 11
- 4620 Steeplechase Ln
- 0 Gateway Ln Unit 7340898
- 4725 Gateway Ln
- 4619 Steeplechase Ln
- 0 Steeplechase Ln Unit 7352309
- 0 Steeplechase Ln Unit 7005177
- 0 Steeplechase Ln Unit 3226178
- 4745 Gateway Ln
- 4608 Steeplechase Ln
- 4740 Gateway Ln
- 4670 Steeplechase Ln
- 4528 Nohl Crest Dr
- 4628 Union Church Rd
- 4602 Steeplechase Ln
- 4675 Steeplechase Ln
- 4529 Nohl Crest Dr
- 4538 Union Church Rd
- 4664. Wilderness Trail
- 4534 Union Church Rd