
Landlord's Agent in 2022
Dean Noah
Noahs' Preferred Properties Mgt Co.
(301) 258-9100
1 Total Sale
Estimated Value: $1,219,000 - $1,331,000
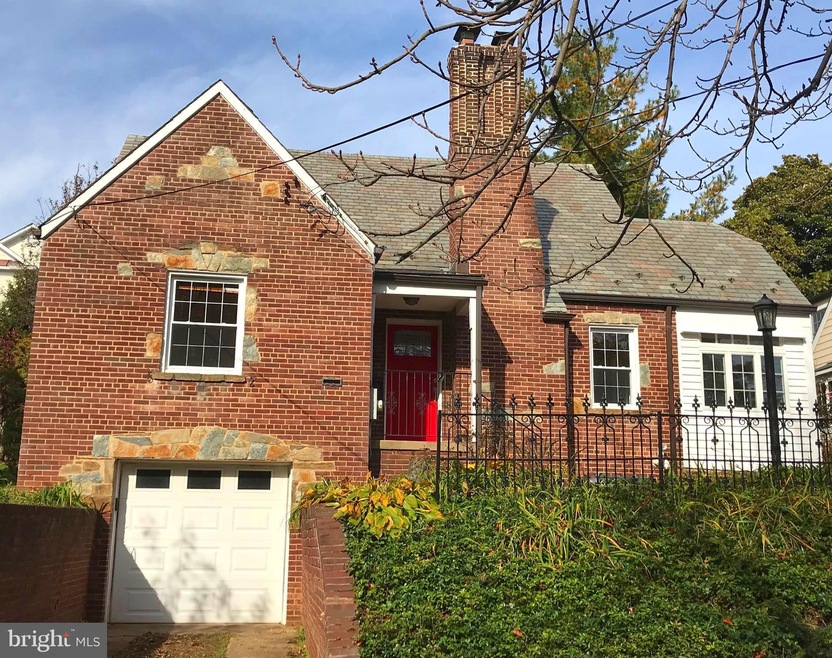
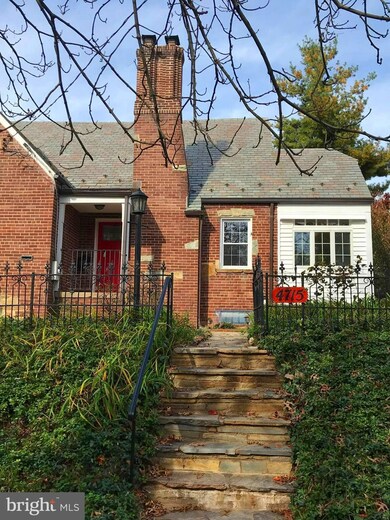
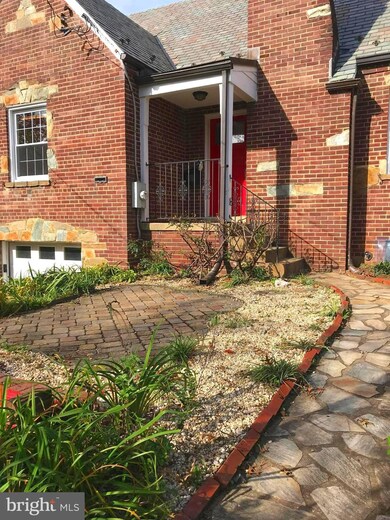
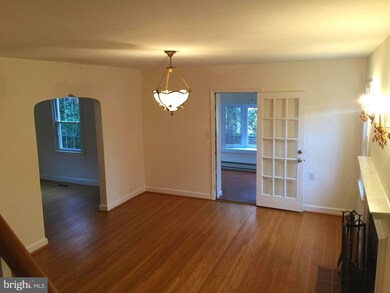
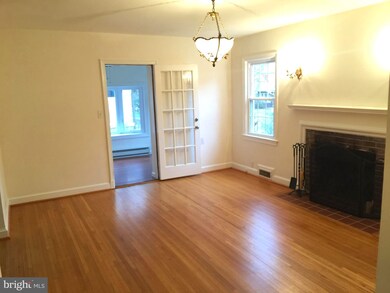
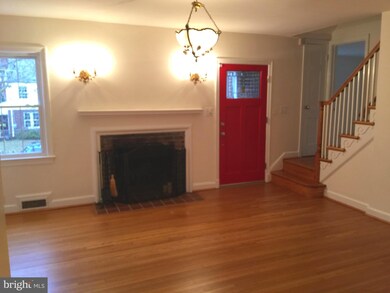
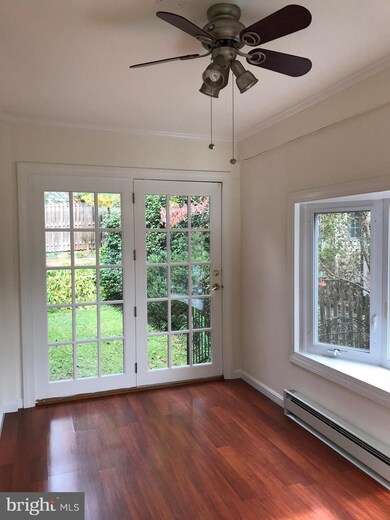
Charming Tudor Cape on mature tree lined street,Bright sun rm addition w/French Doors, HARDWOODS, FPL in LR, open concept kit w/ 1/2 wall, gorgeous landscaping, Ample Storage in basement ** WALK to downtown Bethesda shops,restaurants,movies, metro, CAPITAL CRESCENT TRAIL and Friendship Heights! ** Dogs allowed case by case with $30 additional rent and $500 sec dep. ** We have an in-house Maint Dept for QUICK repair response/ 24 hrs emergency. * AGENTS read the Agent Private remarks please !!!. ALL ADULTS must fill out an APP, you will be asked to upload a paystub and copy of drivers license in the app, so best to have those ready on desktop before applying.
Last Agent to Rent the Property
(301) 258-9100 mnoah@noahsproperties.com Noahs' Preferred Properties Mgt Co. License #6412 Listed on: 03/25/2022
Last Renter's Agent
Non Member Member
beta@mris.net Metropolitan Regional Information Systems, Inc.
| Date | Buyer | Sale Price | Title Company |
|---|---|---|---|
| Whung Pai Yei | $534,000 | -- | |
| Whelan Charles | $268,000 | -- | |
| S Colin P | $293,000 | -- | |
| Moore Colin P | $270,000 | -- |
| Date | Status | Borrower | Loan Amount |
|---|---|---|---|
| Previous Owner | Moore Colin P | $256,500 |
| Date | Event | Price | List to Sale | Price per Sq Ft |
|---|---|---|---|---|
| 04/29/2022 04/29/22 | Rented | $3,550 | +1.4% | -- |
| 04/14/2022 04/14/22 | Price Changed | $3,500 | -5.4% | $2 / Sq Ft |
| 04/05/2022 04/05/22 | Price Changed | $3,700 | +5.7% | $2 / Sq Ft |
| 03/25/2022 03/25/22 | For Rent | $3,500 | +7.7% | -- |
| 03/24/2020 03/24/20 | Rented | $3,250 | 0.0% | -- |
| 03/18/2020 03/18/20 | Under Contract | -- | -- | -- |
| 03/12/2020 03/12/20 | Price Changed | $3,250 | -1.5% | $2 / Sq Ft |
| 03/12/2020 03/12/20 | Price Changed | $3,300 | 0.0% | $2 / Sq Ft |
| 03/12/2020 03/12/20 | For Rent | $3,300 | -2.9% | -- |
| 03/11/2020 03/11/20 | Under Contract | -- | -- | -- |
| 02/11/2020 02/11/20 | For Rent | $3,400 | +4.6% | -- |
| 12/07/2018 12/07/18 | Rented | $3,250 | 0.0% | -- |
| 11/30/2018 11/30/18 | Price Changed | $3,250 | -7.1% | $2 / Sq Ft |
| 10/24/2018 10/24/18 | For Rent | $3,500 | -3.6% | -- |
| 02/10/2016 02/10/16 | Rented | $3,630 | 0.0% | -- |
| 02/10/2016 02/10/16 | Under Contract | -- | -- | -- |
| 01/12/2016 01/12/16 | For Rent | $3,630 | +3.9% | -- |
| 01/03/2014 01/03/14 | Rented | $3,495 | 0.0% | -- |
| 01/03/2014 01/03/14 | Under Contract | -- | -- | -- |
| 11/29/2013 11/29/13 | For Rent | $3,495 | -- | -- |
| Year | Tax Paid | Tax Assessment Tax Assessment Total Assessment is a certain percentage of the fair market value that is determined by local assessors to be the total taxable value of land and additions on the property. | Land | Improvement |
|---|---|---|---|---|
| 2025 | $13,070 | $1,123,633 | -- | -- |
| 2024 | $13,070 | $1,077,800 | $850,300 | $227,500 |
| 2023 | $12,417 | $1,022,133 | $0 | $0 |
| 2022 | $7,790 | $966,467 | $0 | $0 |
| 2021 | $9,885 | $910,800 | $809,800 | $101,000 |
| 2020 | $8,301 | $910,800 | $809,800 | $101,000 |
| 2019 | $10,512 | $910,800 | $809,800 | $101,000 |
| 2018 | $16,474 | $941,000 | $771,200 | $169,800 |
| 2017 | $6,275 | $903,167 | $0 | $0 |
| 2016 | -- | $865,333 | $0 | $0 |
| 2015 | $7,788 | $827,500 | $0 | $0 |
| 2014 | $7,788 | $801,800 | $0 | $0 |
Landlord's Agent in 2022
Dean Noah
Noahs' Preferred Properties Mgt Co.
(301) 258-9100
1 Total Sale
N
Tenant's Agent in 2022
Non Member Member
Metropolitan Regional Information Systems
Buyer's Agent in 2020
Eva Davis
Compass
(202) 271-2456
213 Total Sales
Seller's Agent in 2016
Richard Dompka
Long & Foster
(301) 254-8080
51 Total Sales
Buyer's Agent in 2014
Jackie Humenik
RE/MAX
(202) 498-5219
51 Total Sales
Source: Bright MLS
MLS Number: MDMC2043478
APN: 07-00473201
Disclaimer: Certain information contained herein is derived from information provided by parties other than Homes.com. All information provided is deemed reliable, but is not guaranteed to be accurate and should be independently verified.
![]() The data relating to real estate for sale on this website appears in part through the BRIGHT Internet Data Exchange program, a voluntary cooperative exchange of property listing data between licensed real estate brokerage firms, and is provided by BRIGHT through a licensing agreement.
The data relating to real estate for sale on this website appears in part through the BRIGHT Internet Data Exchange program, a voluntary cooperative exchange of property listing data between licensed real estate brokerage firms, and is provided by BRIGHT through a licensing agreement.
Listing information is from various brokers who participate in the Bright MLS IDX program and not all listings may be visible on the site.
The property information being provided on or through the website is for the personal, non-commercial use of consumers and such information may not be used for any purpose other than to identify prospective properties consumers may be interested in purchasing.
Some properties which appear for sale on the website may no longer be available because they are for instance, under contract, sold or are no longer being offered for sale.
Property information displayed is deemed reliable but is not guaranteed.
Copyright 2026 Bright MLS, Inc.
Ask me questions while you tour the home.