M
Seller's Agent in 2023
Morgan Bell
Keller Williams Realty Georgia Communities
Estimated Value: $145,000 - $211,000
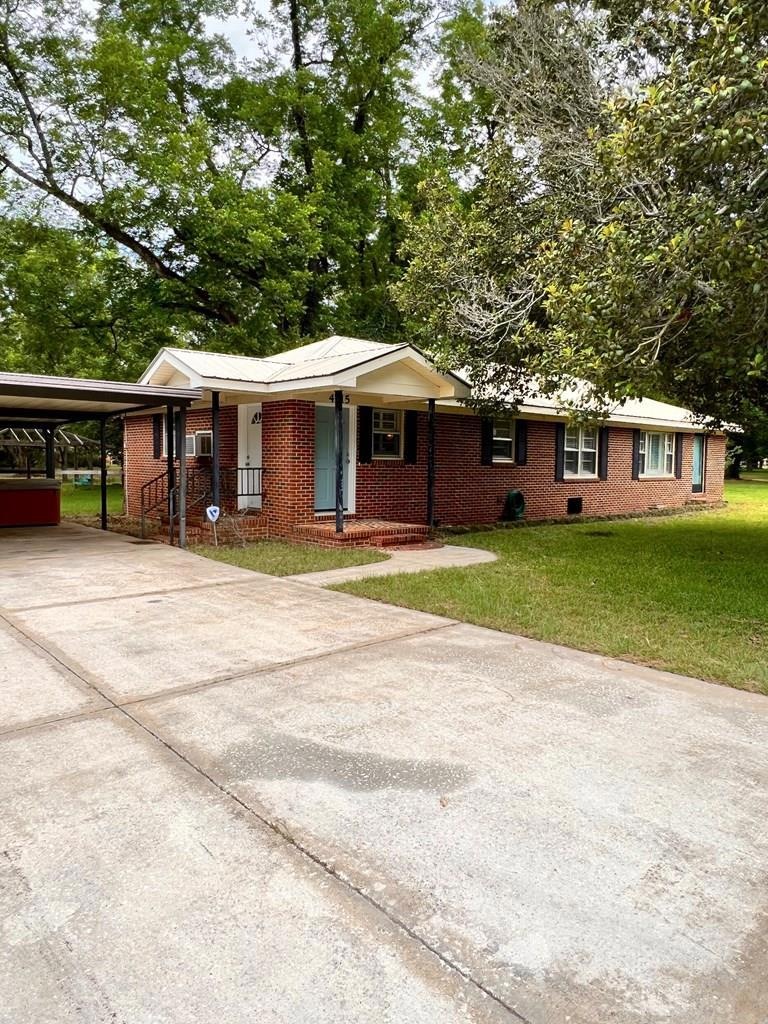
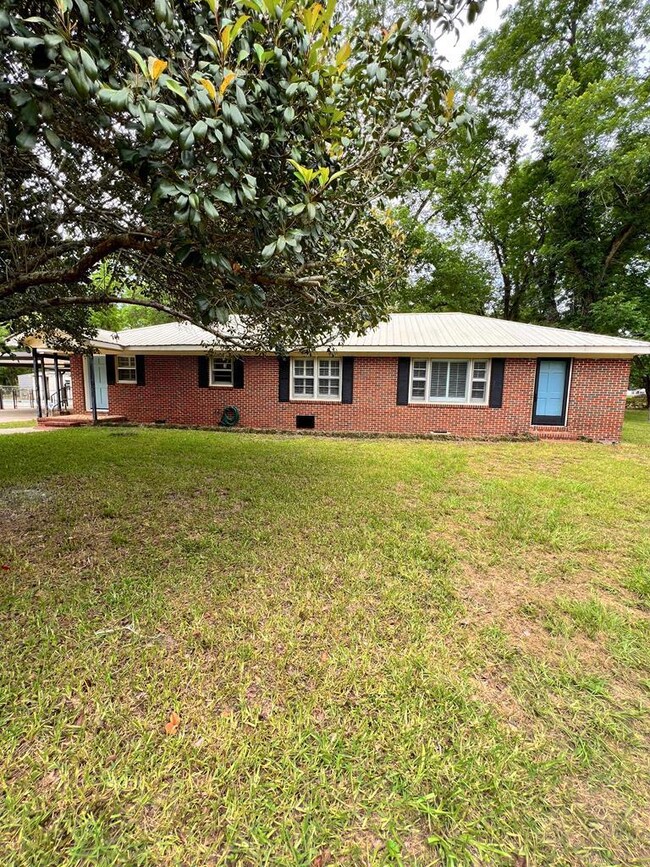
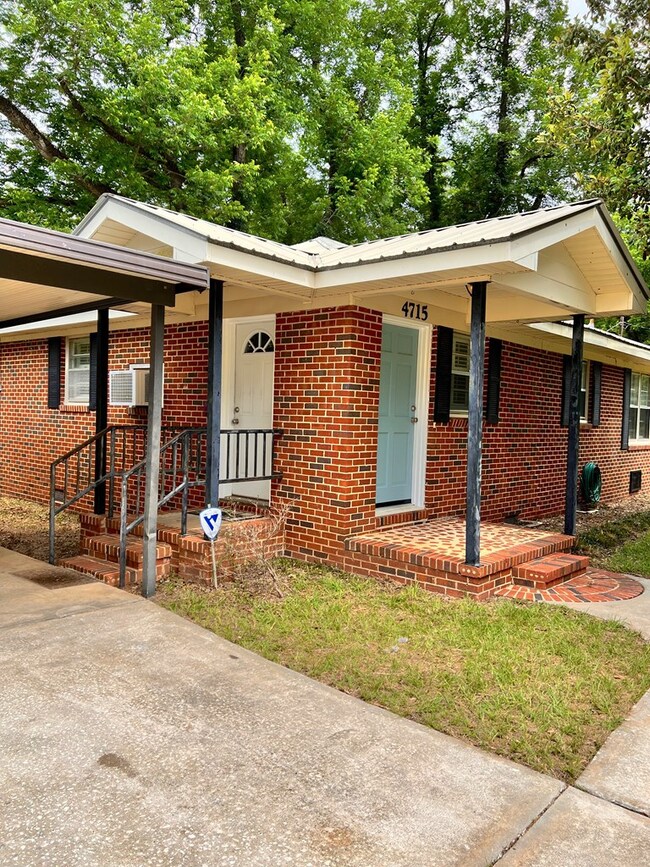
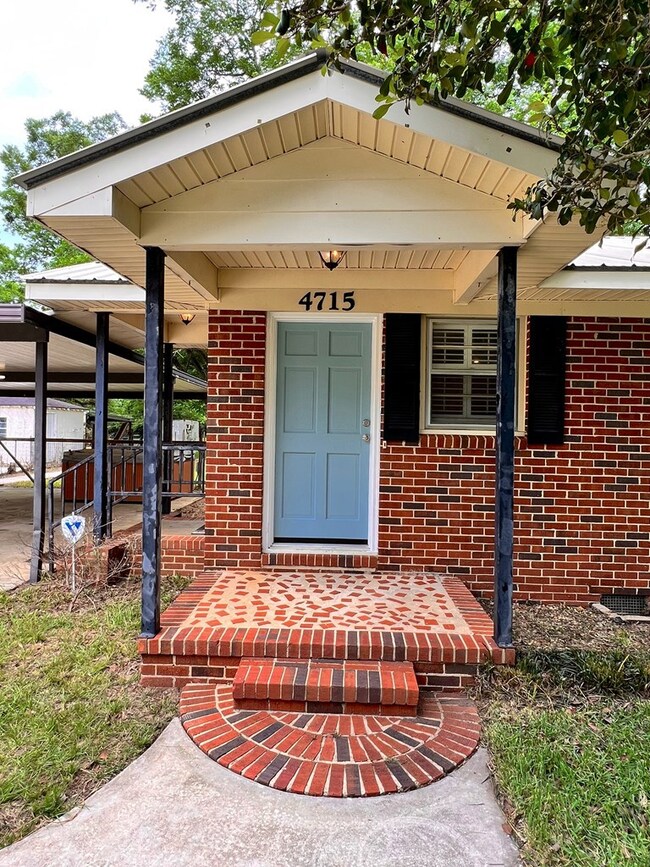
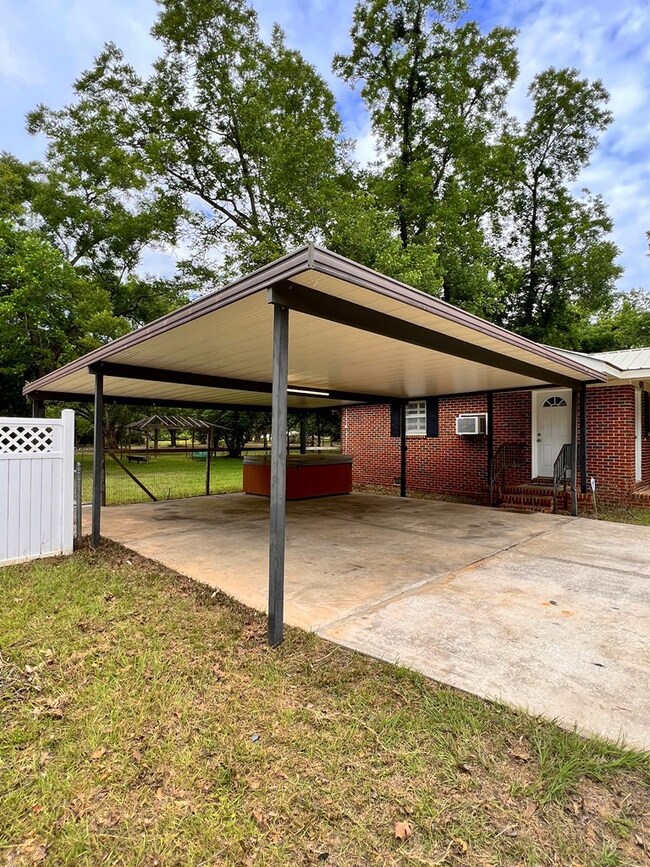
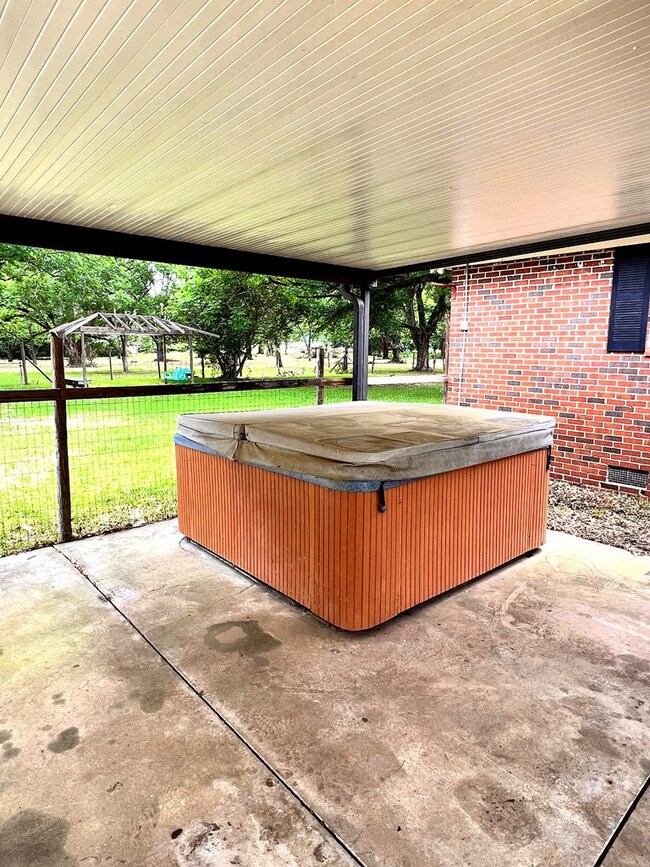
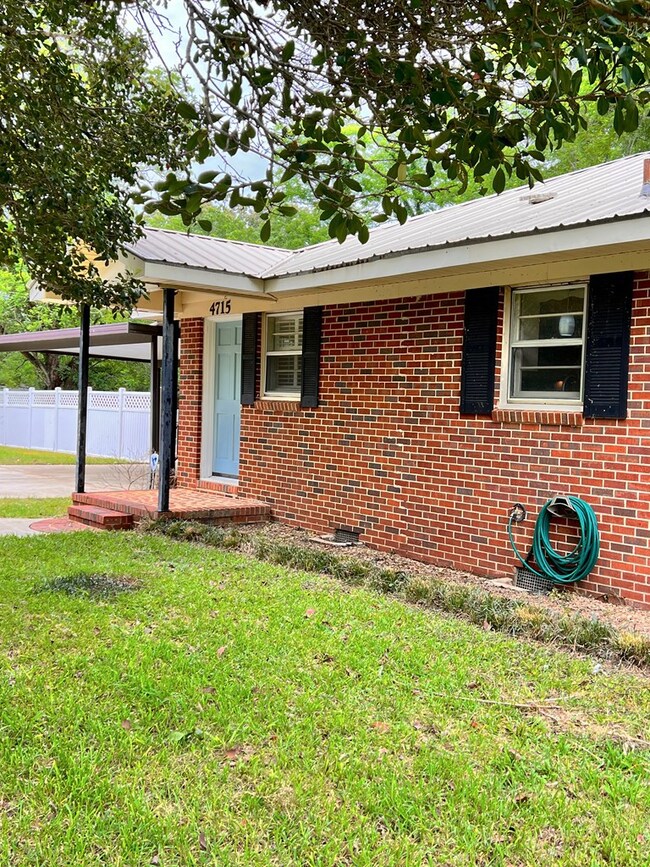
Quiet location on 4.68 acres sitting on the outskirts of Albany, GA. Freshly painted inside with hardwood floors and plantation shutters. Custom masonry in bathroom and kitchen. Two vehicle carport and a pool with a closed in pool house and restroom. Workshop in the backyard with cement slab. Call to take a tour of this beautiful property today!
Last Agent to Sell the Property
Morgan Bell
Keller Williams Realty Georgia Communities Brokerage Phone: 8338331145 License #432078 Listed on: 06/25/2023
Last Buyer's Agent
Morgan Bell
Keller Williams Realty Georgia Communities Brokerage Phone: 8338331145 License #432078 Listed on: 06/25/2023
| Date | Buyer | Sale Price | Title Company |
|---|---|---|---|
| Thaxton Scott | $55,000 | -- | |
| Us Bank National Association As Trustee | $98,600 | -- | |
| Gulley Jameel | $113,000 | -- | |
| Mccoy Bobby | $110,000 | -- | |
| Bland David L | $95,000 | -- | |
| Meyers Meyers E | -- | -- |
| Date | Status | Borrower | Loan Amount |
|---|---|---|---|
| Previous Owner | Gulley Jameel | $90,400 |
| Date | Event | Price | List to Sale | Price per Sq Ft |
|---|---|---|---|---|
| 07/28/2023 07/28/23 | Sold | $170,000 | -- | $103 / Sq Ft |
| 06/25/2023 06/25/23 | Pending | -- | -- | -- |
| Year | Tax Paid | Tax Assessment Tax Assessment Total Assessment is a certain percentage of the fair market value that is determined by local assessors to be the total taxable value of land and additions on the property. | Land | Improvement |
|---|---|---|---|---|
| 2024 | $1,691 | $38,596 | $9,360 | $29,236 |
| 2023 | $860 | $38,596 | $9,360 | $29,236 |
| 2022 | $1,696 | $38,596 | $9,360 | $29,236 |
| 2021 | $1,570 | $38,596 | $9,360 | $29,236 |
| 2020 | $1,572 | $38,596 | $9,360 | $29,236 |
| 2019 | $1,576 | $38,596 | $9,360 | $29,236 |
| 2018 | $1,580 | $38,596 | $9,360 | $29,236 |
| 2017 | $1,551 | $38,596 | $9,360 | $29,236 |
| 2016 | $1,552 | $38,596 | $9,360 | $29,236 |
| 2015 | $1,554 | $38,596 | $9,360 | $29,236 |
| 2014 | $1,422 | $35,796 | $6,560 | $29,236 |
M
Seller's Agent in 2023
Morgan Bell
Keller Williams Realty Georgia Communities
Source: Albany Board of REALTORS®
MLS Number: 153631
APN: 00176-00001-046