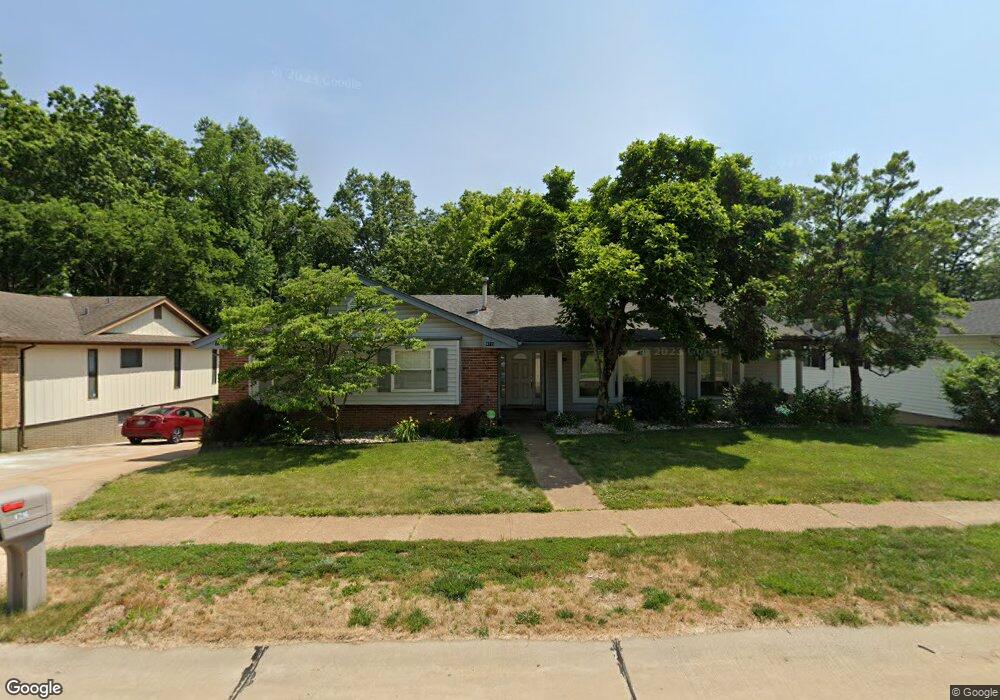
4716 Brookton Way Saint Louis, MO 63128
Estimated Value: $336,200 - $343,000
3
Beds
3
Baths
1,852
Sq Ft
$184/Sq Ft
Est. Value
About This Home
This home is located at 4716 Brookton Way, Saint Louis, MO 63128 and is currently estimated at $340,550, approximately $183 per square foot. 4716 Brookton Way is a home located in St. Louis County with nearby schools including Hagemann Elementary School, Washington Middle School, and Mehlville High School.
Ownership History
Date
Name
Owned For
Owner Type
Purchase Details
Closed on
Oct 19, 2009
Sold by
Anderson Jeffrey Z and Anderson Alyce F
Bought by
Pavlisin Kevin
Current Estimated Value
Home Financials for this Owner
Home Financials are based on the most recent Mortgage that was taken out on this home.
Original Mortgage
$164,835
Interest Rate
5.5%
Mortgage Type
FHA
Purchase Details
Closed on
Mar 25, 2005
Sold by
Schaeffer Jennifer A and Schaeffer Timothy J
Bought by
Anderson Jeffrey Z and Anderson Alyce F
Home Financials for this Owner
Home Financials are based on the most recent Mortgage that was taken out on this home.
Original Mortgage
$183,900
Interest Rate
5.25%
Mortgage Type
Fannie Mae Freddie Mac
Purchase Details
Closed on
Mar 3, 2000
Sold by
West James C and West Charlene
Bought by
Schaeffer Timothy J and Schaeffer Jennifer A
Home Financials for this Owner
Home Financials are based on the most recent Mortgage that was taken out on this home.
Original Mortgage
$152,000
Interest Rate
7.62%
Create a Home Valuation Report for This Property
The Home Valuation Report is an in-depth analysis detailing your home's value as well as a comparison with similar homes in the area
Home Values in the Area
Average Home Value in this Area
Purchase History
| Date | Buyer | Sale Price | Title Company |
|---|---|---|---|
| Pavlisin Kevin | $187,000 | None Available | |
| Anderson Jeffrey Z | $229,900 | -- | |
| Schaeffer Timothy J | $160,000 | -- |
Source: Public Records
Mortgage History
| Date | Status | Borrower | Loan Amount |
|---|---|---|---|
| Previous Owner | Pavlisin Kevin | $164,835 | |
| Previous Owner | Anderson Jeffrey Z | $183,900 | |
| Previous Owner | Schaeffer Timothy J | $152,000 |
Source: Public Records
Tax History Compared to Growth
Tax History
| Year | Tax Paid | Tax Assessment Tax Assessment Total Assessment is a certain percentage of the fair market value that is determined by local assessors to be the total taxable value of land and additions on the property. | Land | Improvement |
|---|---|---|---|---|
| 2025 | $3,521 | $60,460 | $15,870 | $44,590 |
| 2024 | $3,521 | $52,390 | $15,870 | $36,520 |
| 2023 | $3,476 | $52,390 | $15,870 | $36,520 |
| 2022 | $2,841 | $42,970 | $13,220 | $29,750 |
| 2021 | $2,749 | $42,970 | $13,220 | $29,750 |
| 2020 | $2,828 | $42,050 | $11,460 | $30,590 |
| 2019 | $2,820 | $42,050 | $11,460 | $30,590 |
| 2018 | $2,514 | $33,810 | $8,820 | $24,990 |
| 2017 | $2,510 | $33,810 | $8,820 | $24,990 |
| 2016 | $2,496 | $32,250 | $8,820 | $23,430 |
| 2015 | $2,291 | $32,250 | $8,820 | $23,430 |
| 2014 | $2,643 | $36,890 | $7,520 | $29,370 |
Source: Public Records
Map
Nearby Homes
- 4716 Medalton Way
- 5626 Greenton Way
- 5408 Medalton Way
- 4523 Beaver Brook Ct
- 5414 Village Courtway Ln
- 4968 Quail Crest Ct
- 5812 Chrisbrook Dr
- 13266 East Ln
- 5714 Shining Day Place
- 5401 Green Cedar Way Unit 6
- 13232 East Ln
- 5417 Morningdale Place
- 4540 Butler Hill Rd
- 5028 Baldcypress Ct
- 5952 Shortleaf Ct
- 5317 Hamlin Ct
- 5251 Tuscan Chase Ct
- 5161 Butler Bend Dr
- 5134 Butler Hill Ct
- 4374 Bristol View Ct
- 4710 Brookton Way
- 4722 Brookton Way
- 4730 Brookton Way
- 4704 Brookton Way
- 4717 Brookton Way
- 4723 Brookton Way
- 5555 Wieland Dr
- 4711 Brookton Way
- 4705 Brookton Way
- 5561 Wieland Dr
- 4729 Brookton Way
- 4721 Pine Glen Ct
- 4738 Brookton Way
- 4715 Pine Glen Ct
- 4744 Laketon Ct
- 4709 Pine Glen Ct
- 4735 Brookton Way
- 5529 Wieland Dr
- 4703 Pine Glen Ct
- 4741 Brookton Way