Estimated Value: $285,294 - $365,000
4
Beds
2
Baths
1,870
Sq Ft
$173/Sq Ft
Est. Value
About This Home
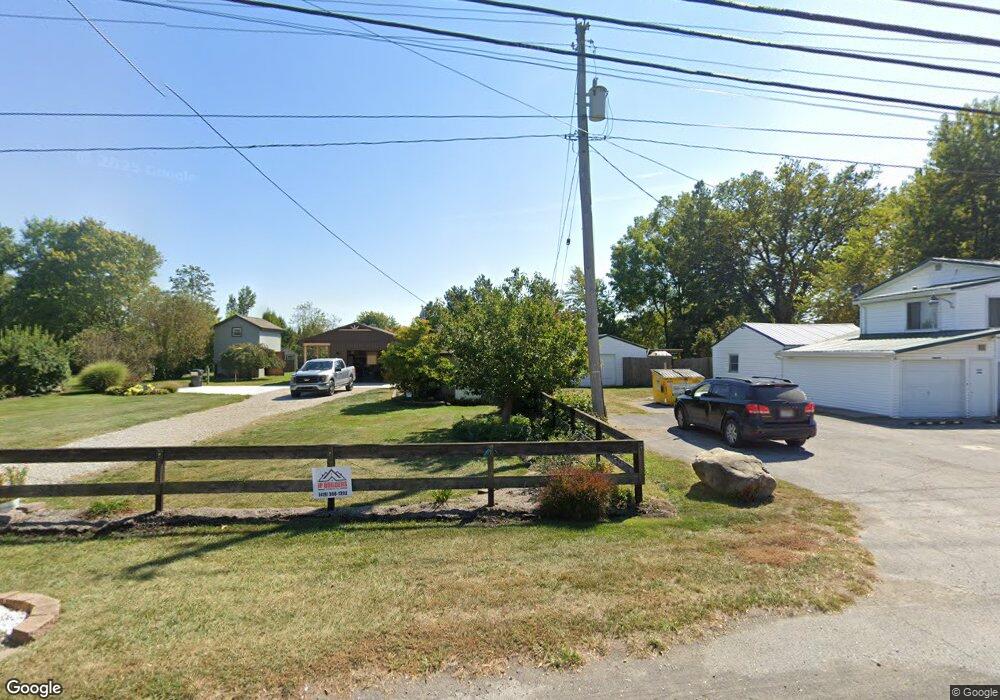
This home is located at 4716 Cleveland Rd E, Huron, OH 44839 and is currently estimated at $322,824, approximately $172 per square foot. 4716 Cleveland Rd E is a home located in Erie County with nearby schools including Vermilion Elementary School, Sailorway Middle School, and Vermilion High School.
Ownership History
Date
Name
Owned For
Owner Type
Purchase Details
Closed on
Feb 5, 2024
Sold by
Albers Jacqueline M
Bought by
Jacqueline M Albers Living Trust and Albers
Current Estimated Value
Purchase Details
Closed on
Feb 19, 2020
Sold by
Albers Jacqueline M
Bought by
Albers Jacqueline M
Purchase Details
Closed on
Dec 1, 2008
Sold by
Albers Jacqueline M
Bought by
Albers Jacqueline M and The Jacqueline M Albers Living Trust
Purchase Details
Closed on
Oct 23, 2008
Sold by
Edwards Thomas P and Edwards Melinda J
Bought by
Albers Jacqueline M
Purchase Details
Closed on
Apr 21, 2006
Sold by
Fresh Laurel J
Bought by
Edwards Thomas P and Edwards Melinda J
Purchase Details
Closed on
Aug 11, 1997
Sold by
Heading Roy A
Bought by
Laurel J Fresh
Home Financials for this Owner
Home Financials are based on the most recent Mortgage that was taken out on this home.
Original Mortgage
$68,000
Interest Rate
7.68%
Mortgage Type
New Conventional
Create a Home Valuation Report for This Property
The Home Valuation Report is an in-depth analysis detailing your home's value as well as a comparison with similar homes in the area
Home Values in the Area
Average Home Value in this Area
Purchase History
| Date | Buyer | Sale Price | Title Company |
|---|---|---|---|
| Jacqueline M Albers Living Trust | -- | Hartung Title | |
| Albers Jacqueline M | -- | Hartung Title | |
| Albers Jacqueline M | -- | None Available | |
| Albers Jacqueline M | $154,500 | Southern Title Of Ohio Ltd | |
| Edwards Thomas P | $84,000 | None Available | |
| Laurel J Fresh | $85,000 | -- |
Source: Public Records
Mortgage History
| Date | Status | Borrower | Loan Amount |
|---|---|---|---|
| Previous Owner | Laurel J Fresh | $68,000 |
Source: Public Records
Tax History
| Year | Tax Paid | Tax Assessment Tax Assessment Total Assessment is a certain percentage of the fair market value that is determined by local assessors to be the total taxable value of land and additions on the property. | Land | Improvement |
|---|---|---|---|---|
| 2024 | $3,095 | $82,704 | $36,788 | $45,916 |
| 2023 | $3,113 | $72,156 | $33,474 | $38,682 |
| 2022 | $3,009 | $72,166 | $33,474 | $38,692 |
| 2021 | $2,989 | $72,160 | $33,470 | $38,690 |
| 2020 | $2,922 | $68,780 | $33,470 | $35,310 |
| 2019 | $2,972 | $68,780 | $33,470 | $35,310 |
| 2018 | $2,976 | $68,780 | $33,470 | $35,310 |
| 2017 | $2,956 | $66,160 | $28,140 | $38,020 |
| 2016 | $2,936 | $66,160 | $28,140 | $38,020 |
| 2015 | $2,887 | $66,160 | $28,140 | $38,020 |
| 2014 | $2,910 | $66,160 | $28,140 | $38,020 |
| 2013 | $2,869 | $66,160 | $28,140 | $38,020 |
Source: Public Records
Map
Nearby Homes
- 4018 Cleveland Rd E
- 5605 W Lake Rd Unit 155
- 5605 W Lake Rd Unit 20
- 5605 W Lake Rd Unit 9
- 5605 W Lake Rd Unit 8
- 5605 W Lake Rd Unit 154
- 5605 W Lake Rd Unit 146
- 5605 W Lake Rd Unit 23
- 5605 W Lake Rd Unit 25
- 5605 W Lake Rd Unit 4
- 5605 W Lake Rd Unit 7
- 5605 W Lake Rd Unit 24
- 5605 W Lake Rd Unit 22
- 5605 W Lake Rd Unit 126
- 5605 W Lake Rd Unit 3
- 5605 W Lake Rd Unit 11
- 5605 W Lake Rd Unit 114
- 5605 W Lake Rd Unit 151
- 5605 W Lake Rd Unit 122
- 5605 W Lake Rd Unit 2
- 4716 Cleveland Rd E
- 4718 Cleveland Rd E
- 4712 Cleveland Rd E
- 4713 Cleveland Rd E
- 4720 Cleveland Rd E
- 1027 West Dr
- 4715 Cleveland Rd E
- 4706 Cleveland Rd E
- 1023 West Dr
- 4702 Cleveland Rd E
- 1025 West Dr
- 1025 West Dr Unit Center Townhome
- 4712 Avenue A
- 4618 W Lake Rd Unit 20
- 4714 Avenue A
- 4703 Cleveland Rd E
- 4705 Cleveland Rd E
- 0 State Rd 6 Unit 4148097
- 1021 West Dr
- 1021 West Dr Unit 4
Your Personal Tour Guide
Ask me questions while you tour the home.