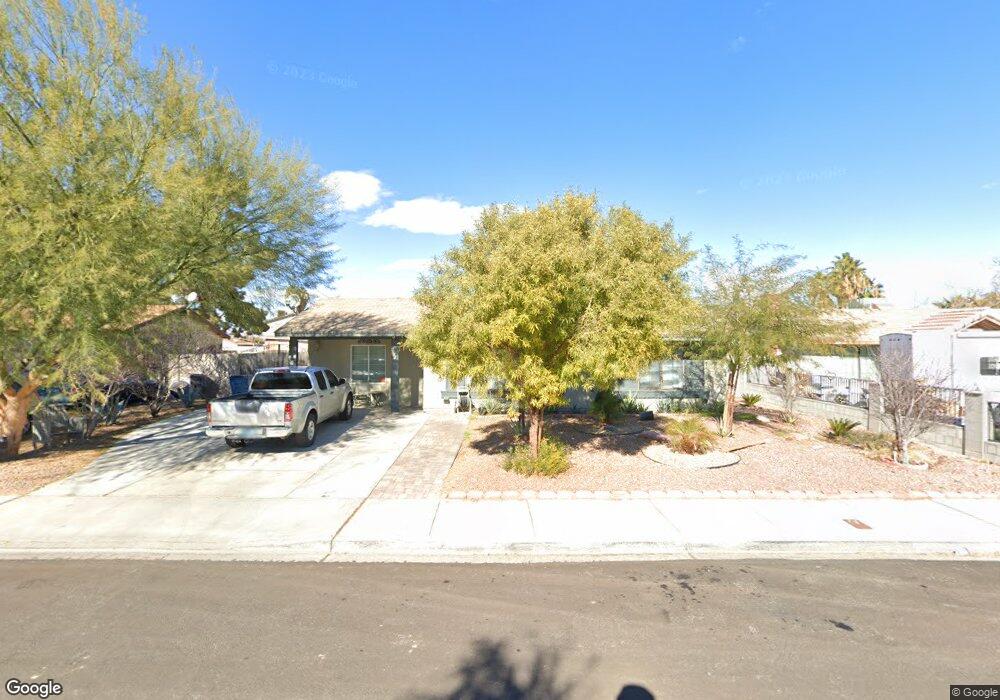
4716 Elm Ave Unit 8 Las Vegas, NV 89110
East Las Vegas NeighborhoodEstimated Value: $242,000 - $340,000
3
Beds
2
Baths
1,100
Sq Ft
$284/Sq Ft
Est. Value
About This Home
This home is located at 4716 Elm Ave Unit 8, Las Vegas, NV 89110 and is currently estimated at $312,591, approximately $284 per square foot. 4716 Elm Ave Unit 8 is a home located in Clark County with nearby schools including Elbert Edwards Elementary School, Dell H Robison Middle School, and Eldorado High School.
Ownership History
Date
Name
Owned For
Owner Type
Purchase Details
Closed on
Aug 14, 2025
Sold by
Gomez Oscar Francisco
Bought by
Gomez Oscar Francisco and De Gonzalez Eva
Current Estimated Value
Purchase Details
Closed on
Sep 21, 2011
Sold by
Deutsche Bank National Trust Company
Bought by
Gomez Oscar Francisco
Purchase Details
Closed on
Jul 27, 2011
Sold by
Jarman Amy and Jarman Joshua
Bought by
Deutsche Bank National Trust Company
Purchase Details
Closed on
Dec 29, 2005
Sold by
Jarman Amy and Homer Amy R
Bought by
Jarman Joshua and Jarman Amy
Home Financials for this Owner
Home Financials are based on the most recent Mortgage that was taken out on this home.
Original Mortgage
$160,000
Interest Rate
1.25%
Mortgage Type
Negative Amortization
Purchase Details
Closed on
Jul 30, 2004
Sold by
Rounds John C and Rounds Karen E
Bought by
Homer Amy R
Home Financials for this Owner
Home Financials are based on the most recent Mortgage that was taken out on this home.
Original Mortgage
$134,500
Interest Rate
7%
Mortgage Type
Unknown
Create a Home Valuation Report for This Property
The Home Valuation Report is an in-depth analysis detailing your home's value as well as a comparison with similar homes in the area
Home Values in the Area
Average Home Value in this Area
Purchase History
| Date | Buyer | Sale Price | Title Company |
|---|---|---|---|
| Gomez Oscar Francisco | $132,837 | None Listed On Document | |
| Gomez Oscar Francisco | $40,500 | Chicago Title The Pointe | |
| Deutsche Bank National Trust Company | $33,000 | Accommodation | |
| Jarman Joshua | -- | Lawyers Title Of Nevada | |
| Homer Amy R | $134,500 | Ticor Title Of Nevada Inc |
Source: Public Records
Mortgage History
| Date | Status | Borrower | Loan Amount |
|---|---|---|---|
| Previous Owner | Jarman Joshua | $160,000 | |
| Previous Owner | Homer Amy R | $134,500 |
Source: Public Records
Tax History Compared to Growth
Tax History
| Year | Tax Paid | Tax Assessment Tax Assessment Total Assessment is a certain percentage of the fair market value that is determined by local assessors to be the total taxable value of land and additions on the property. | Land | Improvement |
|---|---|---|---|---|
| 2025 | $830 | $46,493 | $24,150 | $22,343 |
| 2024 | $806 | $46,493 | $24,150 | $22,343 |
| 2023 | $806 | $48,953 | $26,950 | $22,003 |
| 2022 | $783 | $43,140 | $22,750 | $20,390 |
| 2021 | $760 | $40,706 | $21,000 | $19,706 |
| 2020 | $735 | $39,071 | $19,250 | $19,821 |
| 2019 | $714 | $35,566 | $15,750 | $19,816 |
| 2018 | $693 | $33,256 | $14,000 | $19,256 |
| 2017 | $1,048 | $31,965 | $12,250 | $19,715 |
| 2016 | $658 | $27,949 | $7,000 | $20,949 |
| 2015 | $655 | $20,519 | $5,600 | $14,919 |
| 2014 | $496 | $14,239 | $4,200 | $10,039 |
Source: Public Records
Map
Nearby Homes
- 4705 Elm Ave
- 409 Marion Dr
- 500 Prescott St
- 420 Greenbrook St
- 416 Martha St
- 4632 Shoen Ave
- 4649 Cuva Ct Unit 4
- 158 Palisade Ave
- 4928 Ronan Dr
- 132 Hillsway Dr
- 567 Roxella Ln Unit D
- 579 Roxella Ln Unit D
- 4533 Diamond Head Dr
- 574 Roxella Ln Unit A
- 574 Roxella Ln Unit C
- 4612 Soda Ash Ave
- 45 Logan Ct
- 4820 Mahogany Dr
- 408 Rhoda St
- 4428 Ash Ave