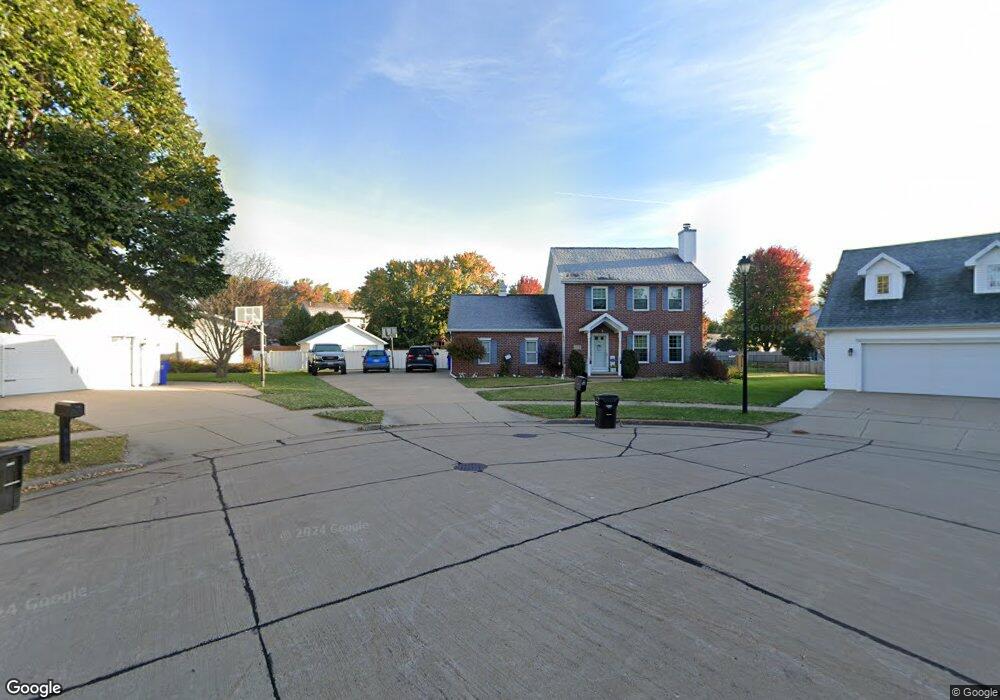
4716 N Chadwicke Ct Appleton, WI 54913
North Appleton NeighborhoodEstimated Value: $345,000 - $476,000
3
Beds
4
Baths
1,917
Sq Ft
$213/Sq Ft
Est. Value
About This Home
This home is located at 4716 N Chadwicke Ct, Appleton, WI 54913 and is currently estimated at $409,136, approximately $213 per square foot. 4716 N Chadwicke Ct is a home located in Outagamie County with nearby schools including Huntley Elementary School, Einstein Middle School, and Appleton North High School.
Ownership History
Date
Name
Owned For
Owner Type
Purchase Details
Closed on
Jul 21, 2022
Sold by
Ste Inmann Aaron and Ste Emilie
Bought by
Johnson Stacey
Current Estimated Value
Home Financials for this Owner
Home Financials are based on the most recent Mortgage that was taken out on this home.
Original Mortgage
$319,113
Outstanding Balance
$305,335
Interest Rate
5.78%
Mortgage Type
FHA
Estimated Equity
$103,801
Purchase Details
Closed on
Jul 14, 2020
Sold by
Haase Jeffrey M
Bought by
Steinman Aaron and Steinman Emilie
Purchase Details
Closed on
Jul 13, 2020
Sold by
Haase Alisha A
Bought by
Haase Jeffrey M
Purchase Details
Closed on
Oct 22, 2012
Sold by
Hasse Jeffrey M and Haase Jeffery M
Bought by
Haase Jeffrey M and Haase Alisha A
Purchase Details
Closed on
Aug 4, 2010
Sold by
Ball Peter J
Bought by
Federal National Mortgage Association
Purchase Details
Closed on
Feb 2, 2005
Sold by
Chavlovich Linda L
Bought by
Ball Peter J
Create a Home Valuation Report for This Property
The Home Valuation Report is an in-depth analysis detailing your home's value as well as a comparison with similar homes in the area
Home Values in the Area
Average Home Value in this Area
Purchase History
| Date | Buyer | Sale Price | Title Company |
|---|---|---|---|
| Johnson Stacey | $325,000 | None Listed On Document | |
| Steinman Aaron | $279,900 | -- | |
| Haase Jeffrey M | $279,900 | -- | |
| Haase Jeffrey M | $168,200 | -- | |
| Federal National Mortgage Association | $165,600 | -- | |
| Ball Peter J | $77,500 | -- |
Source: Public Records
Mortgage History
| Date | Status | Borrower | Loan Amount |
|---|---|---|---|
| Open | Johnson Stacey | $319,113 |
Source: Public Records
Tax History
| Year | Tax Paid | Tax Assessment Tax Assessment Total Assessment is a certain percentage of the fair market value that is determined by local assessors to be the total taxable value of land and additions on the property. | Land | Improvement |
|---|---|---|---|---|
| 2023 | $4,983 | $323,100 | $70,600 | $252,500 |
| 2022 | $4,461 | $215,300 | $61,400 | $153,900 |
| 2021 | $4,257 | $215,300 | $61,400 | $153,900 |
| 2020 | $4,233 | $215,300 | $61,400 | $153,900 |
| 2019 | $4,112 | $215,300 | $61,400 | $153,900 |
| 2018 | $3,642 | $167,800 | $50,000 | $117,800 |
| 2017 | $3,617 | $167,800 | $50,000 | $117,800 |
| 2016 | $3,555 | $167,800 | $50,000 | $117,800 |
| 2015 | $3,611 | $167,800 | $50,000 | $117,800 |
| 2014 | $3,579 | $167,800 | $50,000 | $117,800 |
| 2013 | $3,588 | $167,800 | $46,600 | $121,200 |
Source: Public Records
Map
Nearby Homes
- 1330 N Lake Ct
- 4620 N Lightning Dr
- 2005 E Ridgehaven Ln
- 924 E Pondview Ct
- 3034 E Fallcreek Ln
- 4841 Canvasback Cir
- 125 E Wayfarer Ln
- 8 Fiesta Ct Unit E
- 2911 E Aquamarine Ave
- 321 E Apple Creek Rd
- 3401 N Fiesta Dr
- 324 E Haddonstone Dr
- 134 E Byrd St
- 1910 N Lawe St
- 1908 N Alvin St
- 2325 N Ballard Rd
- 217 E Wentworth Ln
- 4124 E Glory Ln
- 294 E Sweetwater Way
- 6658 N Headwall Cir
- 4716 N Chadwicke Ct
- 4708 N Chadwicke Ct
- 4716 N Chadwicke Ct
- 4700 N Chadwick Ct
- 4708 N Chadwick Ct
- 4717 N Chadwicke Ct
- 4709 N Chadwicke Ct
- 4709 N Chadwicke Ct
- 4701 N Morningview Ct
- 4717 N Morningview Ct
- 4709 N Morningview Ct
- 4701 N Chadwick Ct
- 1625 E Wyndmere Dr
- 1701 E Wyndmere Dr
- 1717 E Wyndmere Dr
- 1617 E Wyndmere Dr
- 1709 E Wyndmere Dr
- 1609 E Wyndmere Dr
- 4708 N Holiday Dr
- 4708 N Morningview Ct