Estimated Value: $1,110,000 - $1,531,000
5
Beds
6
Baths
4,449
Sq Ft
$284/Sq Ft
Est. Value
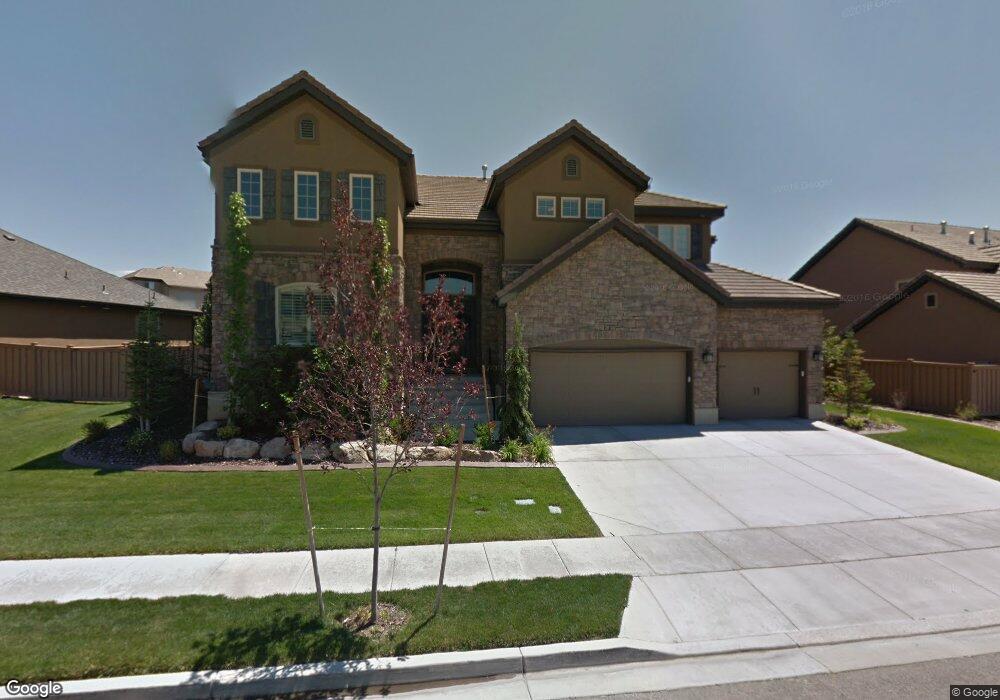
About This Home
This home is located at 4716 N Driftwood View, Lehi, UT 84043 and is currently estimated at $1,263,448, approximately $283 per square foot. 4716 N Driftwood View is a home located in Utah County with nearby schools including Traverse Mountain Elementary School, Skyridge High School, and Ignite Entrepreneurship Academy.
Ownership History
Date
Name
Owned For
Owner Type
Purchase Details
Closed on
Dec 13, 2022
Sold by
Sanchez Christopher R
Bought by
Chris And Shelly Sanchez Family Trust
Current Estimated Value
Purchase Details
Closed on
Jul 19, 2017
Sold by
Spencer Jaimee and Spencer Rachelle
Bought by
Sanchez Christopher R and Sanchez Shelly
Home Financials for this Owner
Home Financials are based on the most recent Mortgage that was taken out on this home.
Original Mortgage
$555,991
Interest Rate
3.89%
Purchase Details
Closed on
Nov 25, 2008
Sold by
Richmond American Homes Of Utah Inc
Bought by
Spencer Jaimee and Spencer Rachelle
Home Financials for this Owner
Home Financials are based on the most recent Mortgage that was taken out on this home.
Original Mortgage
$50,000
Interest Rate
6.47%
Create a Home Valuation Report for This Property
The Home Valuation Report is an in-depth analysis detailing your home's value as well as a comparison with similar homes in the area
Home Values in the Area
Average Home Value in this Area
Purchase History
| Date | Buyer | Sale Price | Title Company |
|---|---|---|---|
| Chris And Shelly Sanchez Family Trust | -- | -- | |
| Sanchez Christopher R | -- | None Available | |
| Spencer Jaimee | -- | First American Union Heig |
Source: Public Records
Mortgage History
| Date | Status | Borrower | Loan Amount |
|---|---|---|---|
| Previous Owner | Sanchez Christopher R | $555,991 | |
| Previous Owner | Spencer Jaimee | $50,000 | |
| Previous Owner | Spencer Jaimee | $415,600 |
Source: Public Records
Tax History Compared to Growth
Tax History
| Year | Tax Paid | Tax Assessment Tax Assessment Total Assessment is a certain percentage of the fair market value that is determined by local assessors to be the total taxable value of land and additions on the property. | Land | Improvement |
|---|---|---|---|---|
| 2025 | $2,336 | $603,790 | $223,800 | $874,000 |
| 2024 | $2,336 | $576,730 | $0 | $0 |
| 2023 | $2,412 | $594,165 | $0 | $0 |
| 2022 | $2,894 | $526,900 | $0 | $0 |
| 2021 | $2,495 | $765,400 | $153,500 | $611,900 |
| 2020 | $2,268 | $812,000 | $142,100 | $669,900 |
| 2019 | $3,533 | $676,100 | $142,100 | $534,000 |
| 2018 | $3,414 | $617,700 | $138,500 | $479,200 |
| 2017 | $3,469 | $333,685 | $0 | $0 |
| 2016 | $3,581 | $319,605 | $0 | $0 |
| 2015 | $3,345 | $283,360 | $0 | $0 |
| 2014 | $3,066 | $258,170 | $0 | $0 |
Source: Public Records
Map
Nearby Homes
- 2082 Wild Rose Ct
- 4425 N Ridge View Way
- 4394 N Foxtrail Dr
- Eleanor Plan at La Ringhiera
- Spruce Pantry Plan at La Ringhiera
- Redwood Plan at La Ringhiera
- Mesquite Plan at La Ringhiera
- Madison Plan at La Ringhiera
- Basswood Plan at La Ringhiera
- Willow Plus Plan at La Ringhiera
- Merriwood Plan at La Ringhiera
- Sycamore Plan at La Ringhiera
- Linden Plan at La Ringhiera
- Roosevelt Plan at La Ringhiera
- Washington Plan at La Ringhiera
- Aspen Plan at La Ringhiera
- Harrison Plan at La Ringhiera
- Yukon Plan at La Ringhiera
- Ash Plan at La Ringhiera
- Hickory Plan at La Ringhiera
- 4716 N Driftwood View
- 4728 N Driftwood View
- 4692 N Driftwood View
- 4729 N Driftwood View
- 4719 N Driftwood View
- 4729 N Driftwood View
- 4676 N Driftwood View
- 1981 W Driftwood View
- 2048 W Woodberry Dr
- 2001 W Whisper Wood Dr
- 1951 Driftwood View Dr
- 1951 W Driftwood View
- 4652 N Driftwood View
- 2065 W Wild Rose Ct
- 2065 W Wild Rose Ct
- 2065 W Wild Rose Ct Unit 331
- 2066 W Woodberry Dr
- 2059 Woodberry Dr
- 2083 Woodberry Dr
- 2048 Woodberry Dr