Estimated Value: $375,000 - $407,000
3
Beds
2
Baths
1,705
Sq Ft
$231/Sq Ft
Est. Value
About This Home
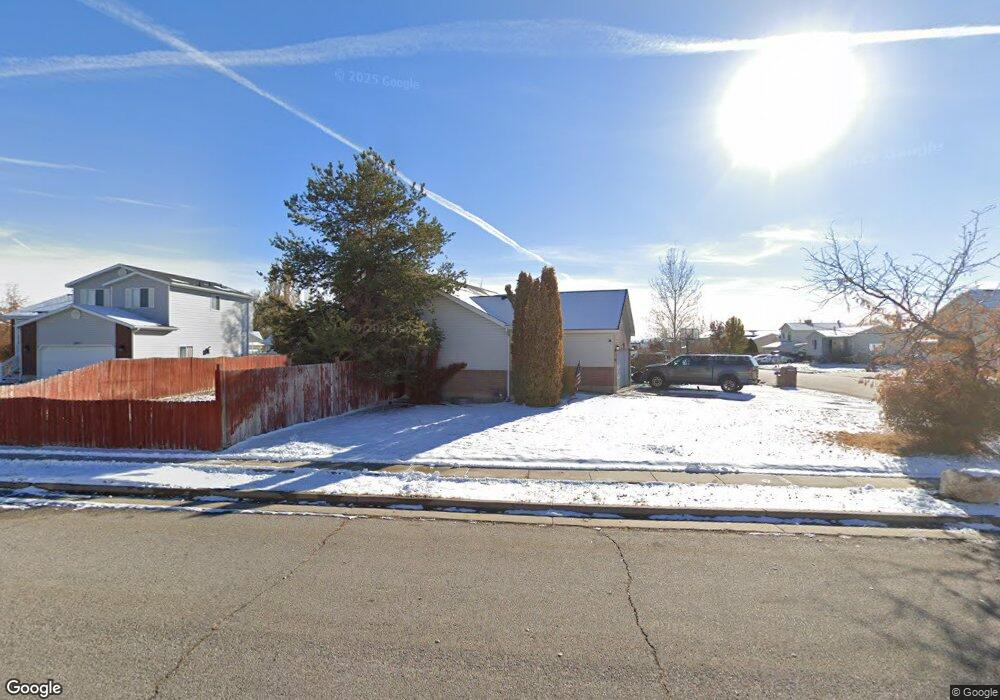
This home is located at 4716 S 3950 W, Roy, UT 84067 and is currently estimated at $394,156, approximately $231 per square foot. 4716 S 3950 W is a home located in Weber County with nearby schools including West Haven School, Sand Ridge Junior High School, and Roy High School.
Ownership History
Date
Name
Owned For
Owner Type
Purchase Details
Closed on
Nov 25, 2014
Sold by
American Homes 4 Rent Properties Three L
Bought by
Amh 2014 3 Borrower Llc
Current Estimated Value
Purchase Details
Closed on
Feb 27, 2013
Sold by
Smith Spencer H
Bought by
American Homes 4 Rent Properties Three L
Purchase Details
Closed on
Dec 14, 2006
Sold by
Diarte Travis J and Diarte Jodee R
Bought by
Smith Spencer H
Home Financials for this Owner
Home Financials are based on the most recent Mortgage that was taken out on this home.
Original Mortgage
$165,000
Interest Rate
6.32%
Mortgage Type
Purchase Money Mortgage
Purchase Details
Closed on
Oct 28, 1996
Sold by
Haskell Homes Inc
Bought by
Diarte Travis J and Diarte Jodee R
Home Financials for this Owner
Home Financials are based on the most recent Mortgage that was taken out on this home.
Original Mortgage
$92,850
Interest Rate
8.11%
Purchase Details
Closed on
Apr 26, 1996
Sold by
Newport Holding Inc
Bought by
Haskell Homes Inc
Create a Home Valuation Report for This Property
The Home Valuation Report is an in-depth analysis detailing your home's value as well as a comparison with similar homes in the area
Home Values in the Area
Average Home Value in this Area
Purchase History
| Date | Buyer | Sale Price | Title Company |
|---|---|---|---|
| Amh 2014 3 Borrower Llc | -- | None Available | |
| American Homes 4 Rent Properties Three L | -- | Inwest Title Services Inc | |
| Smith Spencer H | -- | First American Title Legend | |
| Diarte Travis J | -- | Security Title | |
| Haskell Homes Inc | -- | Superior Title |
Source: Public Records
Mortgage History
| Date | Status | Borrower | Loan Amount |
|---|---|---|---|
| Previous Owner | Smith Spencer H | $165,000 | |
| Previous Owner | Diarte Travis J | $92,850 |
Source: Public Records
Tax History Compared to Growth
Tax History
| Year | Tax Paid | Tax Assessment Tax Assessment Total Assessment is a certain percentage of the fair market value that is determined by local assessors to be the total taxable value of land and additions on the property. | Land | Improvement |
|---|---|---|---|---|
| 2025 | $2,362 | $369,850 | $130,015 | $239,835 |
| 2024 | $2,307 | $364,000 | $130,015 | $233,985 |
| 2023 | $2,239 | $354,000 | $124,980 | $229,020 |
| 2022 | $2,302 | $376,000 | $110,001 | $265,999 |
| 2021 | $2,058 | $306,000 | $79,963 | $226,037 |
| 2020 | $1,914 | $261,000 | $79,963 | $181,037 |
| 2019 | $1,813 | $232,000 | $49,906 | $182,094 |
| 2018 | $1,677 | $201,000 | $42,041 | $158,959 |
| 2017 | $1,525 | $170,000 | $42,041 | $127,959 |
| 2016 | $1,493 | $89,630 | $21,944 | $67,686 |
| 2015 | $1,365 | $83,514 | $21,944 | $61,570 |
| 2014 | $1,256 | $75,059 | $19,237 | $55,822 |
Source: Public Records
Map
Nearby Homes
- 4024 W 4650 S
- 4094 W 4700 S
- 4097 W 4750 S
- 4106 W 4875 S
- 4890 S 4075 W
- 3671 W 4700 S
- 3692 W 4625 S
- 3669 W 4625 S
- 4141 W 4875 S
- 4990 S 4075 W
- 3652 W 4625 S
- 3632 W 4650 S
- 3627 W 4650 S
- 4021 W 5000 S
- 3820 Foxglen Dr
- Villages Townhome Plan at Green Farm - Villages
- Poplar Plan at Highgate Cove
- Pando Plan at Highgate Cove
- 4756 S 4300 W
- 5013 S 4150 W