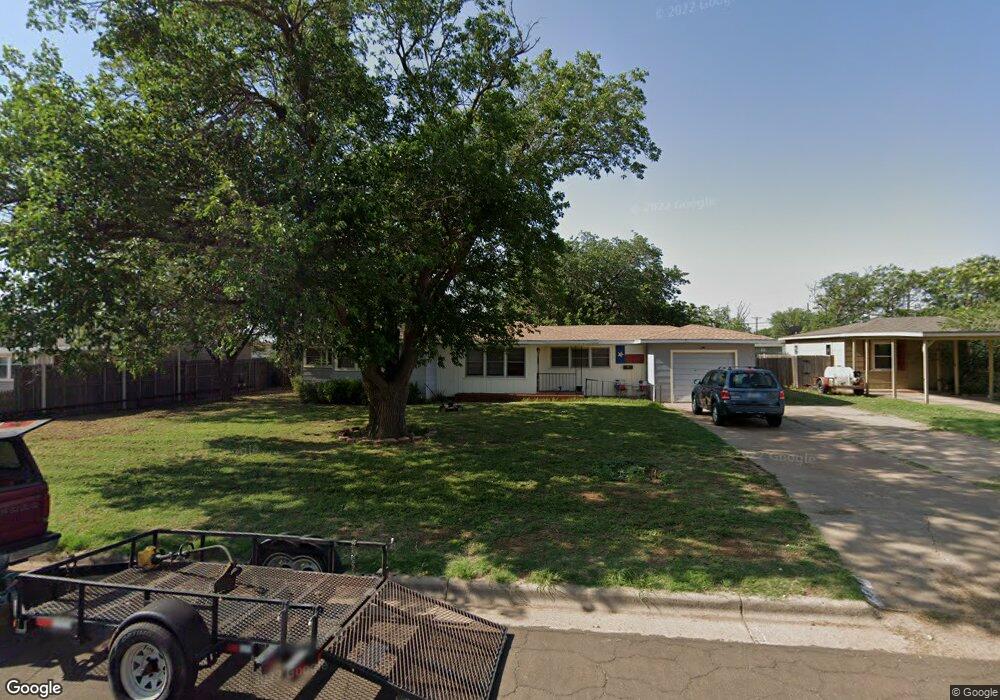
4717 39th St Lubbock, TX 79414
Stubbs-Stewart NeighborhoodEstimated Value: $124,000 - $134,000
3
Beds
1
Bath
1,052
Sq Ft
$121/Sq Ft
Est. Value
About This Home
This home is located at 4717 39th St, Lubbock, TX 79414 and is currently estimated at $127,436, approximately $121 per square foot. 4717 39th St is a home located in Lubbock County with nearby schools including Stewart Elementary School, Commander William C. McCool Academy, and Irons Middle School.
Ownership History
Date
Name
Owned For
Owner Type
Purchase Details
Closed on
Dec 11, 2017
Sold by
Armour John Lawrence
Bought by
Armour Investments Llc
Current Estimated Value
Purchase Details
Closed on
Oct 19, 2017
Sold by
Armour Timmons Llc
Bought by
Armour John L
Purchase Details
Closed on
Jan 1, 2007
Sold by
Timmons Doris and Armour Denise
Bought by
Armour Timmons Llc
Purchase Details
Closed on
Sep 16, 1999
Sold by
Garrett S E Estate
Bought by
Armour Timmons Llc
Create a Home Valuation Report for This Property
The Home Valuation Report is an in-depth analysis detailing your home's value as well as a comparison with similar homes in the area
Home Values in the Area
Average Home Value in this Area
Purchase History
| Date | Buyer | Sale Price | Title Company |
|---|---|---|---|
| Armour Investments Llc | -- | None Available | |
| Armour Investments Llc | -- | None Available | |
| Armour John L | -- | None Available | |
| Armour Timmons Llc | -- | None Available | |
| Armour Timmons Llc | -- | -- |
Source: Public Records
Tax History Compared to Growth
Tax History
| Year | Tax Paid | Tax Assessment Tax Assessment Total Assessment is a certain percentage of the fair market value that is determined by local assessors to be the total taxable value of land and additions on the property. | Land | Improvement |
|---|---|---|---|---|
| 2025 | $2,046 | $96,872 | $27,500 | $69,372 |
| 2024 | $2,046 | $112,677 | $25,000 | $87,677 |
| 2023 | $1,940 | $104,348 | $9,200 | $95,148 |
| 2022 | $1,820 | $89,902 | $9,200 | $80,702 |
| 2021 | $1,749 | $81,660 | $9,200 | $72,460 |
| 2020 | $1,854 | $85,282 | $9,200 | $76,082 |
| 2019 | $1,559 | $69,432 | $9,200 | $60,232 |
| 2018 | $1,703 | $75,773 | $9,200 | $66,573 |
| 2017 | $1,705 | $75,773 | $9,200 | $66,573 |
| 2016 | $1,622 | $72,074 | $9,200 | $62,874 |
| 2015 | $1,475 | $67,791 | $9,200 | $58,591 |
| 2014 | $1,475 | $66,355 | $6,500 | $59,855 |
Source: Public Records
Map
Nearby Homes