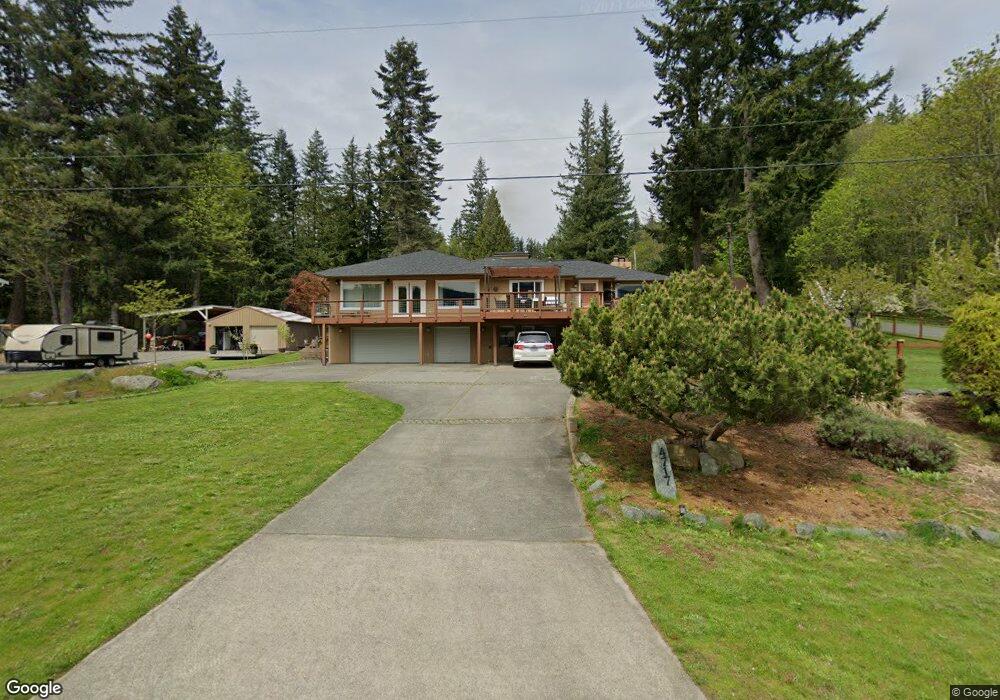
4717 College St Bellingham, WA 98229
Samish NeighborhoodEstimated Value: $931,000 - $1,240,000
5
Beds
4
Baths
3,050
Sq Ft
$352/Sq Ft
Est. Value
About This Home
This home is located at 4717 College St, Bellingham, WA 98229 and is currently estimated at $1,073,765, approximately $352 per square foot. 4717 College St is a home located in Whatcom County with nearby schools including Wade King Elementary School, Fairhaven Middle School, and Sehome High School.
Ownership History
Date
Name
Owned For
Owner Type
Purchase Details
Closed on
Jul 13, 2019
Sold by
Zographos Anthony G
Bought by
Zographos Anthony G and The Zographos Family Trust
Current Estimated Value
Purchase Details
Closed on
Nov 14, 2018
Sold by
Zographos Susan Elizabeth and Zographos Ahthony G
Bought by
Zographos Anthony G
Home Financials for this Owner
Home Financials are based on the most recent Mortgage that was taken out on this home.
Original Mortgage
$100,000
Outstanding Balance
$63,344
Interest Rate
4.9%
Mortgage Type
New Conventional
Estimated Equity
$1,010,421
Purchase Details
Closed on
Apr 23, 2015
Sold by
Hart Ronald W and Hart Lynnie A
Bought by
Ron & Lynn Hart Family Trust and Hart Lynnie A
Purchase Details
Closed on
Sep 17, 2003
Sold by
Trutanich Van J
Bought by
Hart Ronald W and Hart Lynnie A
Home Financials for this Owner
Home Financials are based on the most recent Mortgage that was taken out on this home.
Original Mortgage
$248,000
Interest Rate
6.17%
Mortgage Type
Purchase Money Mortgage
Create a Home Valuation Report for This Property
The Home Valuation Report is an in-depth analysis detailing your home's value as well as a comparison with similar homes in the area
Home Values in the Area
Average Home Value in this Area
Purchase History
| Date | Buyer | Sale Price | Title Company |
|---|---|---|---|
| Zographos Anthony G | -- | None Available | |
| Zographos Anthony G | -- | Whatcom Land Title | |
| Zographos Anthony G | $540,000 | Whatcom Land Title | |
| Ron & Lynn Hart Family Trust | -- | None Available | |
| Hart Ronald W | $310,000 | First American Title Ins |
Source: Public Records
Mortgage History
| Date | Status | Borrower | Loan Amount |
|---|---|---|---|
| Open | Zographos Anthony G | $100,000 | |
| Previous Owner | Hart Ronald W | $248,000 |
Source: Public Records
Tax History Compared to Growth
Tax History
| Year | Tax Paid | Tax Assessment Tax Assessment Total Assessment is a certain percentage of the fair market value that is determined by local assessors to be the total taxable value of land and additions on the property. | Land | Improvement |
|---|---|---|---|---|
| 2024 | $7,105 | $881,681 | $270,304 | $611,377 |
| 2023 | $7,105 | $913,203 | $279,968 | $633,235 |
| 2022 | $5,822 | $777,199 | $238,272 | $538,927 |
| 2021 | $5,411 | $626,790 | $192,160 | $434,630 |
| 2020 | $5,314 | $549,811 | $168,560 | $381,251 |
| 2019 | $5,055 | $521,890 | $160,000 | $361,890 |
| 2018 | $5,248 | $497,709 | $141,050 | $356,659 |
| 2017 | $4,625 | $441,788 | $125,200 | $316,588 |
| 2016 | $4,214 | $406,899 | $115,200 | $291,699 |
| 2015 | $4,147 | $385,966 | $109,200 | $276,766 |
| 2014 | -- | $367,575 | $104,000 | $263,575 |
| 2013 | -- | $348,890 | $100,000 | $248,890 |
Source: Public Records
Map
Nearby Homes
- 2600 42nd
- 2604 S 42nd St
- 2608 S 42nd St
- 4203 Harrison St
- 1912 S Colby Ct
- 2500 Samish Way Unit 50
- 2500 Samish Way Unit 13
- 2010 Samish Crest Way
- 4915 Samish Way Unit 60
- 4915 Samish Way Unit 66
- 955 Colony Ct
- 750 Samish Way
- 1800 40th Place
- 4949 Samish Way Unit 6
- 1615 Samish Way
- 1758 Old Samish Rd
- 2174 Yew Street Rd Unit 22
- 921 Whitewater Dr
- 3204 30th St
- 3605 Mill Ave