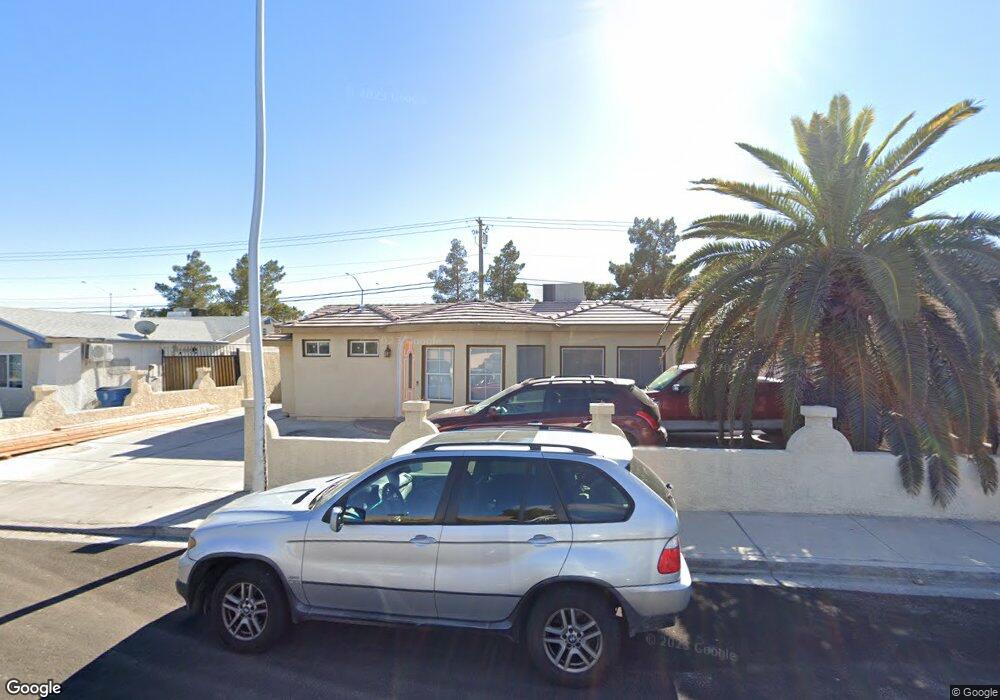
4717 Metpark Dr Las Vegas, NV 89110
East Las Vegas NeighborhoodEstimated Value: $278,000 - $341,000
2
Beds
1
Bath
1,100
Sq Ft
$286/Sq Ft
Est. Value
About This Home
This home is located at 4717 Metpark Dr, Las Vegas, NV 89110 and is currently estimated at $314,206, approximately $285 per square foot. 4717 Metpark Dr is a home located in Clark County with nearby schools including Elbert Edwards Elementary School, Dell H Robison Middle School, and Eldorado High School.
Ownership History
Date
Name
Owned For
Owner Type
Purchase Details
Closed on
May 28, 2004
Sold by
Lopez Jose Salvador and Lopez Jose
Bought by
Lopez Jose Salvador and Lopez Blanca Ibonne
Current Estimated Value
Home Financials for this Owner
Home Financials are based on the most recent Mortgage that was taken out on this home.
Original Mortgage
$103,700
Interest Rate
6.09%
Mortgage Type
New Conventional
Purchase Details
Closed on
Apr 8, 2000
Sold by
Panzer Larry O
Bought by
Lopez Jose
Home Financials for this Owner
Home Financials are based on the most recent Mortgage that was taken out on this home.
Original Mortgage
$83,015
Interest Rate
8.22%
Mortgage Type
FHA
Purchase Details
Closed on
Aug 12, 1997
Sold by
Va
Bought by
Panzer Larry O
Home Financials for this Owner
Home Financials are based on the most recent Mortgage that was taken out on this home.
Original Mortgage
$57,950
Interest Rate
7.57%
Mortgage Type
Seller Take Back
Purchase Details
Closed on
Jun 11, 1996
Sold by
Hibbard Carol
Bought by
Va
Create a Home Valuation Report for This Property
The Home Valuation Report is an in-depth analysis detailing your home's value as well as a comparison with similar homes in the area
Home Values in the Area
Average Home Value in this Area
Purchase History
| Date | Buyer | Sale Price | Title Company |
|---|---|---|---|
| Lopez Jose Salvador | -- | Land Title Of Nevada | |
| Lopez Jose | $83,700 | Old Republic Title Company | |
| Panzer Larry O | -- | -- | |
| Va | -- | Land Title |
Source: Public Records
Mortgage History
| Date | Status | Borrower | Loan Amount |
|---|---|---|---|
| Closed | Lopez Jose Salvador | $103,700 | |
| Closed | Lopez Jose | $83,015 | |
| Previous Owner | Panzer Larry O | $57,950 |
Source: Public Records
Tax History Compared to Growth
Tax History
| Year | Tax Paid | Tax Assessment Tax Assessment Total Assessment is a certain percentage of the fair market value that is determined by local assessors to be the total taxable value of land and additions on the property. | Land | Improvement |
|---|---|---|---|---|
| 2025 | $681 | $42,672 | $24,150 | $18,522 |
| 2024 | $662 | $42,672 | $24,150 | $18,522 |
| 2023 | $662 | $45,326 | $26,950 | $18,376 |
| 2022 | $643 | $39,786 | $22,750 | $17,036 |
| 2021 | $624 | $37,524 | $21,000 | $16,524 |
| 2020 | $603 | $35,958 | $19,250 | $16,708 |
| 2019 | $585 | $32,428 | $15,750 | $16,678 |
| 2018 | $568 | $29,489 | $13,300 | $16,189 |
| 2017 | $946 | $28,850 | $12,250 | $16,600 |
| 2016 | $540 | $24,158 | $7,000 | $17,158 |
| 2015 | $537 | $21,047 | $5,600 | $15,447 |
| 2014 | $800 | $15,434 | $4,200 | $11,234 |
Source: Public Records
Map
Nearby Homes
- 4705 Elm Ave
- 409 Marion Dr
- 4649 Cuva Ct Unit 4
- 158 Palisade Ave
- 4632 Shoen Ave
- 416 Martha St
- 420 Greenbrook St
- 500 Prescott St
- 4928 Ronan Dr
- 132 Hillsway Dr
- 4820 Mahogany Dr
- 45 Logan Ct
- 11 Page St
- 4709 Mahogany Dr
- 4436 E Ogden Ave
- 4533 Diamond Head Dr
- 4428 Ash Ave
- 567 Roxella Ln Unit D
- 4437 Isabella Ave
- 579 Roxella Ln Unit D
- 4721 Metpark Dr
- 4713 Metpark Dr
- 4709 Metpark Dr
- 4725 Metpark Dr
- 4712 Metpark Dr
- 4720 Metpark Dr
- 4708 Metpark Dr
- 4729 Metpark Dr
- 4705 Metpark Dr
- 4724 Metpark Dr
- 4716 Ballantine Dr
- 4720 Ballantine Dr
- 4712 Ballantine Dr
- 4704 Metpark Dr
- 4724 Ballantine Dr
- 4717 Shoen Ave
- 4708 Ballantine Dr
- 4713 Shoen Ave
- 4733 Metpark Dr
- 4728 Metpark Dr